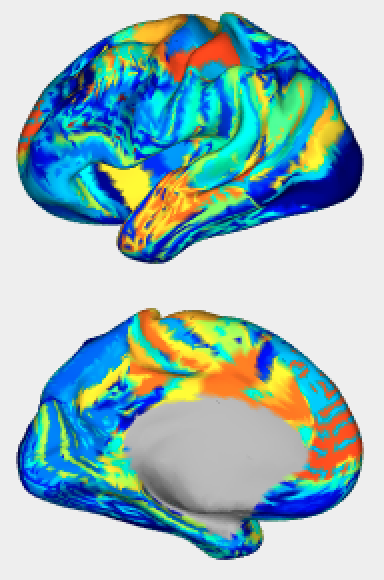
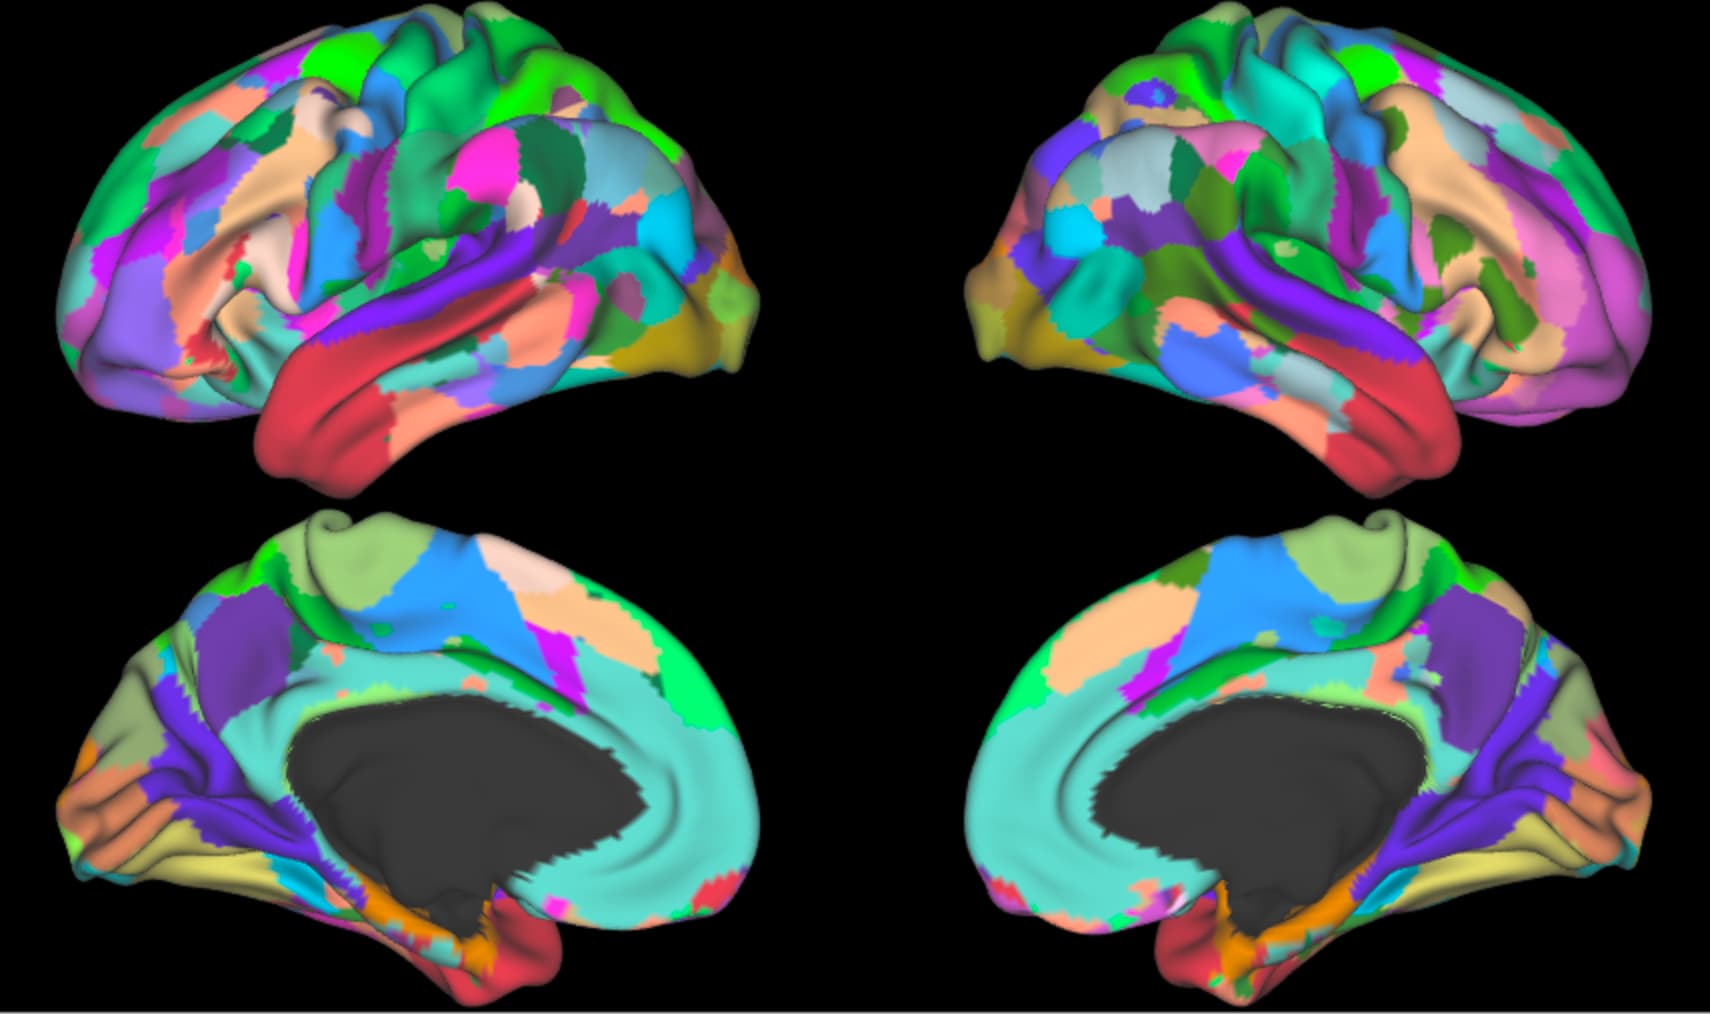
HCP S1200 provides brain parcellations from group ICA with different resolutions (15, 25, 50, … clusters). However from its visualization, it is so broken (one hemisphere below) and far from what I expected. Is it really a brain parcellation?
file path: HCP1200_Parcellation_Timeseries_Netmats.zip → groupICA → groupICA_3T_HCP1200_MSMAII_d15.ica → molodic_IC_ftb.dlabel.nii