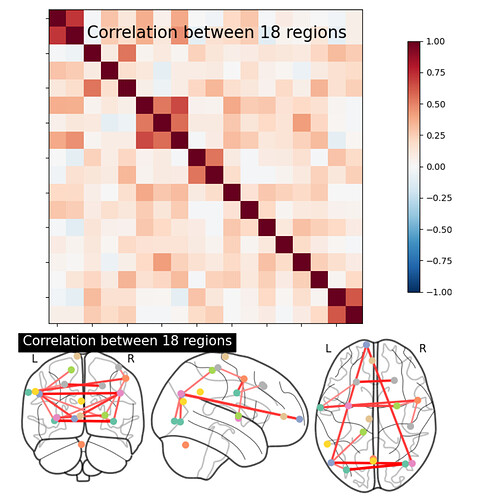
I know that coords_connectome in this example gives the 3D coodinates of each dot, but is there any way to numerically identify the connections between each dot (as in which dots are connected to which other ones?)
Nilearn: Statistical Analysis for NeuroImaging in Python — Machine learning for NeuroImaging
I don’t think we have a public function that does directly and exactly this in Nilearn, but I think you should be able to do the following to threshold your adjacency matrix:
import numpy as np
from scipy.stats import scoreatpercentile
from nilearn._utils.param_validation import check_threshold

# I'm using this as the adjacency matrix
A = np.random.random((100, 100))
# Using 90% for the edge threshold as in the example you linked
t = check_threshold(
    "90%", np.abs(A.ravel()), scoreatpercentile, 'edge_threshold'
)
# Get the connections after thresholding
A[np.abs(A) < t] = 0
HTH,
Nicolas
Sorry can you please explain what A is?
It is the connectivity matrix. In the example you linked, you’d replace A by mean_correlations.
Just so I can confirm that I understand:
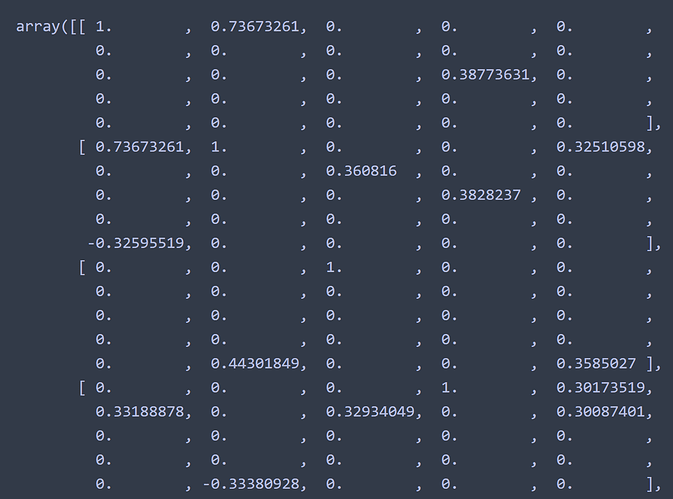
I applied this to my own code independent from the docs and got 25 regions. Printing mean_correlations shows a matrix which is composed of 25 sub-matrices. Each sub-matrix represents a region, and each element of the sub-matrix indicates the magnitude of correlation between that region and one of the other 25 regions, right? For example, the 1st region has a 0.736 correlation with the 6th region.
Do I have this right?
I’m not sure to follow here. I don’t know what computations you are doing in your own code, but in the example you linked, you have the following:
-
n_subject=20This is specified in the data fetcher at the begining - For each subject, you have a
(50, 59, 50, 168)image, that is the length of time series will be168 - The
RegionExtractorextracts signals of length 168 forn_regions_extractedregions which can vary (I have 20 and you seem to have 25) - Then, for each subject, you compute the correlations between time series. That is, or each subject, you have
n_regions_extractedtime series, each of length168, so each correlation matrix isn_regions_extractedxn_regions_extracted, and you haven_subjectsof these matrices. - You compute the mean across subjects:
mean_correlationsis thusn_regions_extractedxn_regions_extracted
So, mean_correlations[i, j] is the average correlation (across subjects) between signals extracted for region i and region j.
Does this make sense?
Nicolas

