Dear colleagues,
I am doing voxel-based morphometry of the T1 structural MRI dataset of 20 age/gender-matched case-control.
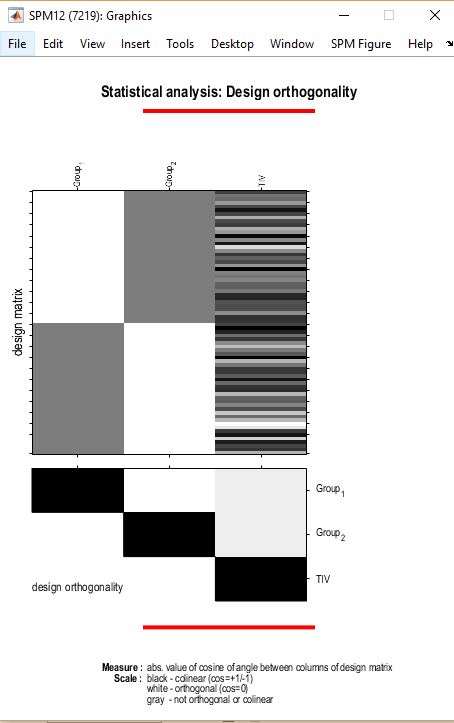
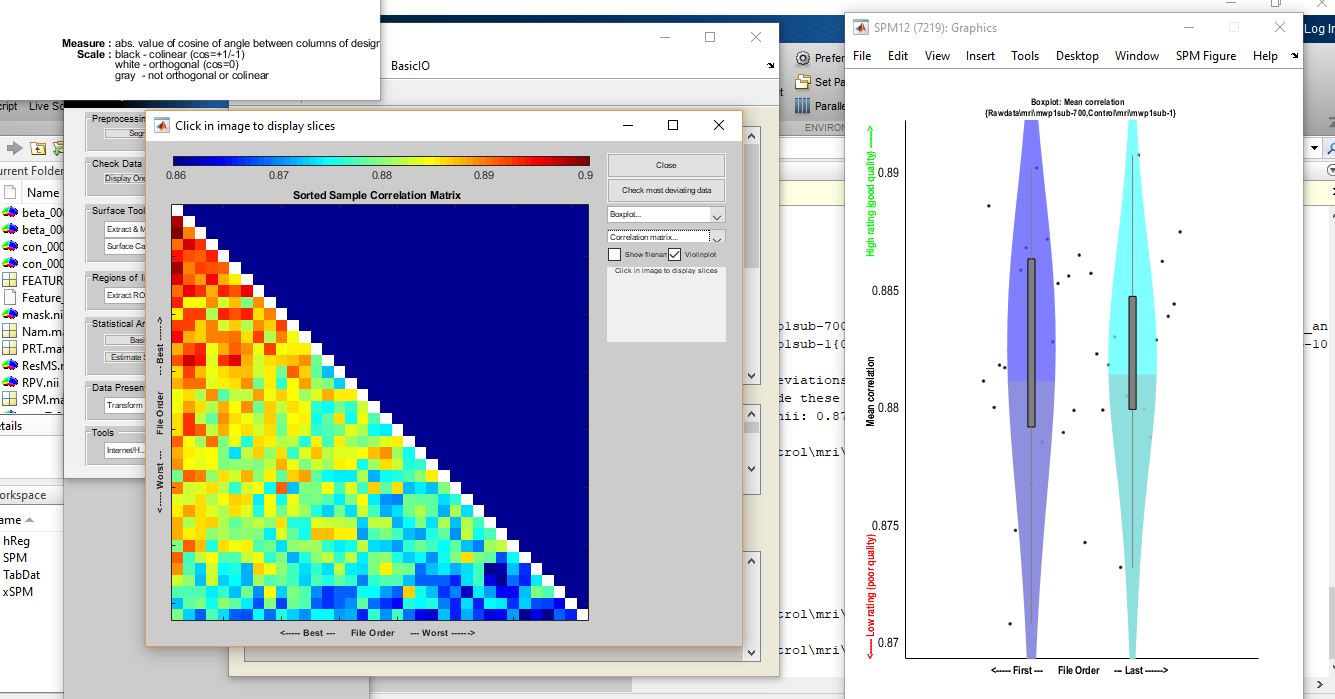
The t-test showed significant uncorrected p=value, however, it shows non-significant corrected p-value (FWE). Colleagues advised that this is may be caused by the data, so I checked the design orthogonality and homogeneity and this graph was the result, it showed low-quality MRI. when I remove these images, more and more bad quality subjects appear
Is this interpretation correct? What should I do regarding low-quality images and does it affect the results?
There’s a bit to unpack in this question. I’ll try to tackle some of it (and maybe there will be some differing opinions from others):
- I don’t see anything egregious from the correlation matrix or box plot. These plot out the correlations between the individuals modulated, normalized scans. There are (just at an eyeball level) a couple of individuals that are unlike the others (bottom 2 have lower correlations across the board) but the correlations are all > 0.85. So I’d be hestitant to exclude anyone solely on the basis of these plots.
- Workflow matters when it comes to CAT12 (or any processing). What processing steps did you take? What version of CAT12?
- Your design orthogonality plot is cut off. What are your covariates? What test set up did you use?
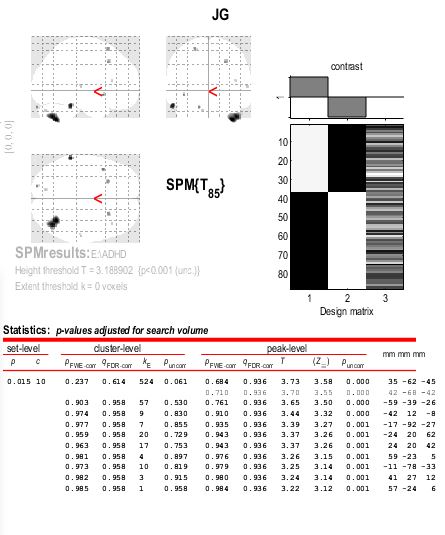
- Statistical significance at an uncorrected level that doesn’t survive FWE correction does not inherently mean a “problem” with the data. It may simply be that your data are not “different enough” to survive when adjusting for the sheer number of comparisons being performed. What was your threshold for uncorrected p-value significance? Can you share the glass brain and cluster table plot?
Hope this helps. Welcome others’ comments and hopefully some responses from you @samokhalil.
1 Like
Thank you for your response
2- I used the processing steps in the CAT12 manual/ version is 12.6
3- I only used TIV as a nuisance parameter as I did age and gender case-control group match. I used a two-sample t-test
4- the threshold for uncorrected p-value is 0.001
5- I want to add that all the images had the quality of B after processing, Can I still do the analysis with those images?
Thank you again for your response
Hi @samokhalil,
To this point, I don’t see anything in what you’ve provided that would lead me to think you can’t use your whole dataset. However, your design matrix suggests that you don’t have a balanced design (i.e., group 2 appears to be larger). A consequence of this may be that your age/gender matching isn’t exact and you may consider including those as covariates (each mean centered across the whole dataset using CAT12). Also, is TIV mean-centered?
Beyond that, there’s something to understand about the p-values you are seeing. The “statistically significant at p < 0.001” findings apply to the peak voxels only. At the cluster level, you have one cluster in the cerebellum that is statistically significant at p = 0.061. Thus, the lack of statistically significant findings after multiple comparisons correction is due to the lack of statistically significant cluster-level findings prior to MC correction.
1 Like
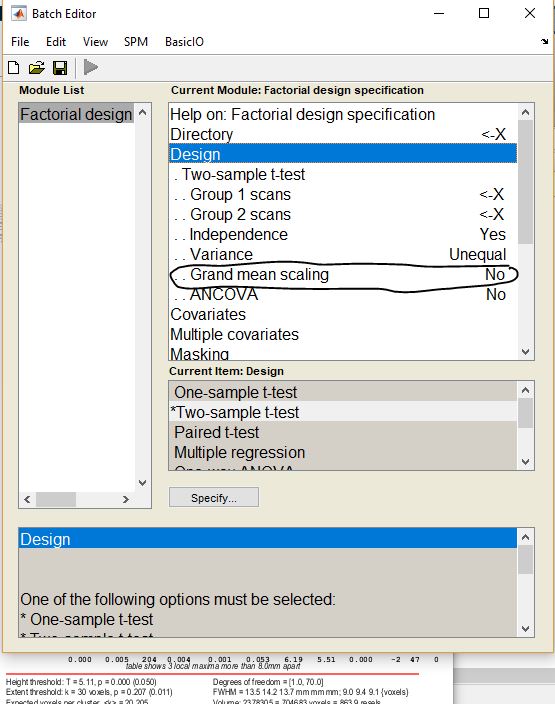
I used this option and then it becomes significant, What is the meaning of this option ad how it is different from the overall grand mean scaling in the second picture?
I used TIV mean centered and I matched 1:1 in the last analysis
here is the second picture
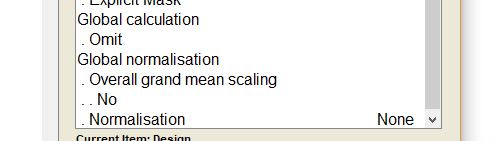
Grand mean scaling adjusts/scales the inputs by a value (the mean TIV or some value). The first image is a flag (yes or no) and the second defines the value to scale by as this affects the masking.
Unless your TIV is non-orthogonal to other covariates or the groups, you should likely leave these as “no.”
Also, I’m not clear what you mean that you matched 1:1 in your last analysis. Did you use different samples for the uncorrected and corrected analyses?
1 Like
In the first analysis, it was 2 control for one case. I matched using matchit package in r. I used age and gender match. In the last analysis, I matched 1 control for 1 case using age and gender. each set was used for the same corrected and uncorrected analysis
One last question, how to make sure that TIV is not orthogonal to the the data? as it is only significant when I consider it as non- orthogonal
Thank you very much for your help