I am using tedana (23.0.1) for multi-echo fMRI denoising. Due to reviewer comments on a manuscript, we are exploring the use of multi-echo fMRI for extracting potential hemodynamic parameters across the brain. I am specifically interested in brain hemodynamics associated with variation in peripheral pulse amplitude (derived via peak-to-peak amplitude of a pulse oximeter), a potential indicator of sympathetic-driven vasoconstriction.
My analysis is separately cross-correlating (voxel-wise) intercept (s0) and t2* fMRI signals derived from tedana tedana.decay.fit_decay_ts with pulse amplitude signals. One of the datasets we are testing this analysis on is Nathan Spreng’s labs OpenNeuro dataset (OpenNeuro).
Our motivation for separately analyzing s0 and t2 effects is based on two studies:
Bianciardi et al. (2011; JCBFM) - Negative BOLD-fMRI signals in large cerebral veins - PMC - used a model to demonstrate that opposite responses to a visual stimulus between t2* (negative) and s0 (positive) signals in and around veins are indicative of local blood volume changes.
These studies suggest that some s0 effects may reflect physiologically meaningful information, particularly blood volume changes. Of course, in most brain mapping experiments, this would be considered ‘noise’.
In our analysis of cross-correlations with pulse amplitudes we are seeing a similar opposite effect of t2* and s0 signals in ventricles and posterior draining veins.
My questions to the experts are these:
Is this an appropriate usage of tedana.decay.fit_decay_ts workflow?
From my reading of the ME-ICA denoising literature, variation in the intercept has generally been attributed to coil sensitivity, head motion, and/or inflow effects. Does anyone have any insight on when/where it might contain blood volume effects?
Though I understand the gist of the arguments put forward by the above cited studies, I don’t have a good intuition of how blood volume effects would show up as variations in the intercept (s0). Does anyone have any insight into how such an effect would occur?
Wow, I wasn’t aware of those findings regarding S0 and T2*. That’s really interesting!
I think @handwerkerd, @dowdlelt, and @CesarCaballeroGaudes might be able to weigh in, but my first thought is that you might need more than three echoes for volume-wise T2* and S0 estimation. Also, if your goal is T2*/S0 estimation rather than multi-echo denoising, you may want to use a dataset with TEs that go up to 1.5x the highest T2* value you’d expect to see (that came up in Compare two protocols for TEDANA - #15 by dowdlelt).
Indeed, that’s a very interesting research question!! I’m aware of Bianciardi’s and Havlicek’s works, but never thought of a pure physiological contribution (pulse oximeter) to S0 fluctuations.
Yes, that’s an appropriate usage of tedana.decay.fit_decay_ts. However, I agree with @tsalo that more echoes will allow you obtain better estimates of T2* and S0 timecourses.
Indeed, not all changes in S0 signals are related to artefacts!! In fact, our MEPFM approach also aims to estimate T2* (and S0 timecourses) via a hemodynamic deconvolution framework. We observed good results with only three echoes. In our first implementation of the MEPFM approach, relative changes in S0 were also estimated along with relative changes in T2*. For certain trials, we observed simultaneous changes in S0 and T2, where the former were not related to artefacts (assessed visually). However, I would comment that increased blood volume can also produce positive R2*, not only changes in S0. Complicated relationships!!
Btw, we (@smoia) collected the Euskalibur dataset in 10 subjects, 10 sessions each, with several RS and tasks per session (5 TEs, 2.4x2.4x3 mm3 voxels, TR=1.5s, SMS=5, GRAPPA=2 with whole-brain coverage). All of them with physiological recordings. DM if you are interested!!
It sounds like we’ll need more echos if we want to to pursue these findings. @CesarCaballeroGaudes that sounds like a perfect dataset to more accurately estimate these effects. I’ll reach out!
I’ll concur with @tsalo and @CesarCaballeroGaudes. I think you can use tedana’s fit decay, but it would definitely be noisier. If it were possible to get a solid T2* and S0 estimate with just fit_decay_ts then multi-echo denoising would be much easier. They noted more echoes can help, but, if you’re designing a new study, more trials with more trial averaging might also be useful.
As for S0 hemodynamic effects, this is effectively what VASO and a lot of the high resolution layer fMRI methods are trying to do. CBV changes are more localized to capillaries than T2* and potentially help with more precise localization, but most of those CBV-selective methods are fighting with worse SNR than standard T2*-weight EPI imaging. Still, that might be a good literature to dig into. I think some pulse sequences like VASO and VAPER have options for multi-echo, which might create an opportunity for more direct comparisons.
One other thing I want to mention is that several people focus on the lateral ventricles to look for effects that are not caused by T2* change in blood. The choroid plexus is highly vascularized and floating in the ventricles. I suspect some ventricle effects we see are due to the choroid plexus. If digging into that interests you, I’m very happy to talk more.
Thank you @handwerkerd ! That’s very helpful. I wasn’t aware of that link with the VASO sequence. I’ll read into that literature to get a better grounding in all this.
For more context, we’re attempting to dissect the pattern of cross-correlations between voxel-wise fMRI signals and the pulse amplitude. One prominent pattern (which has been observed by others) is negative correlation in the ventricles, white matter and posterior draining veins.
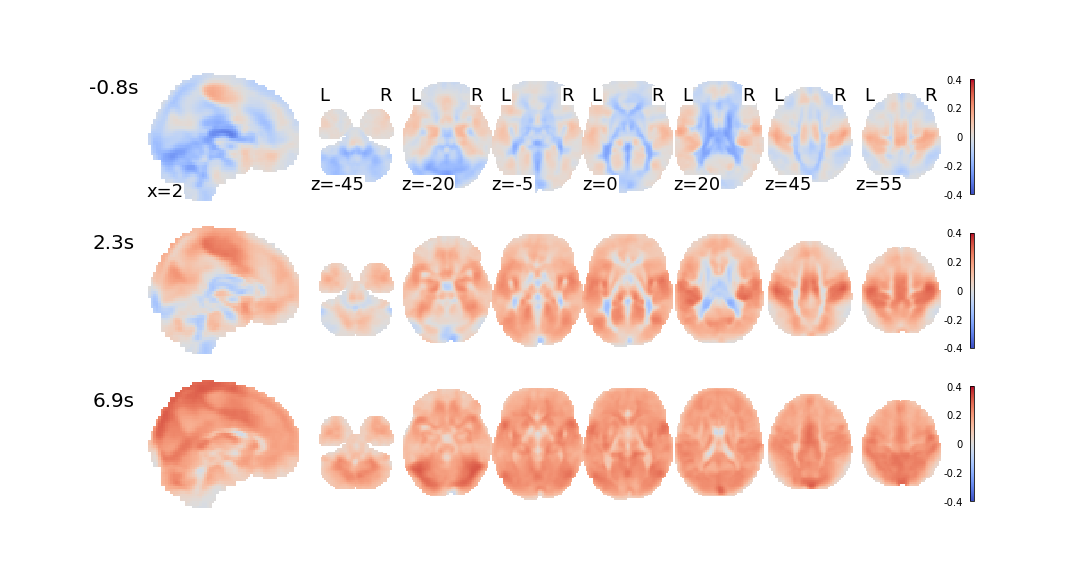
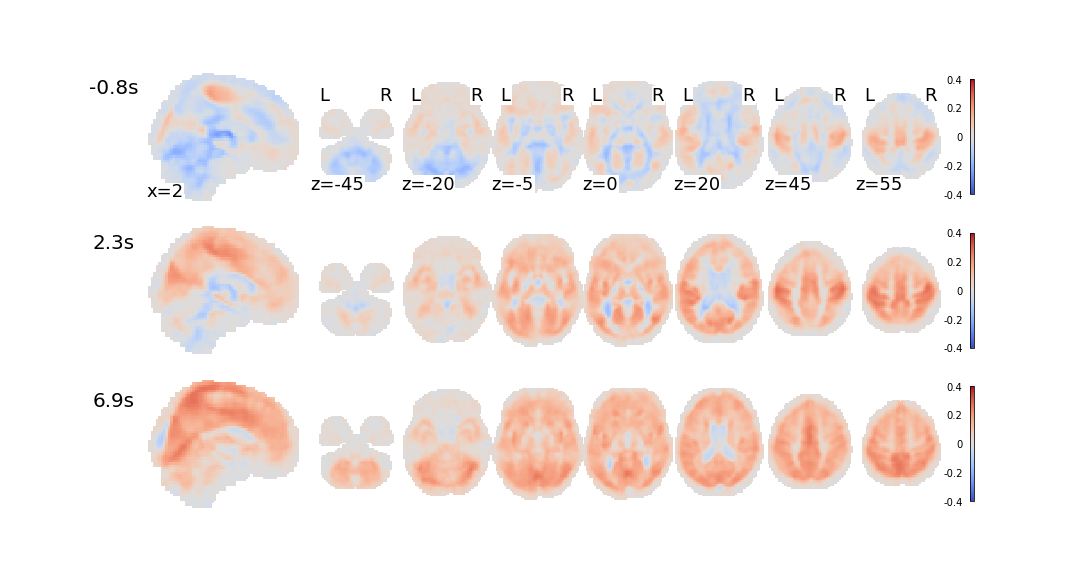
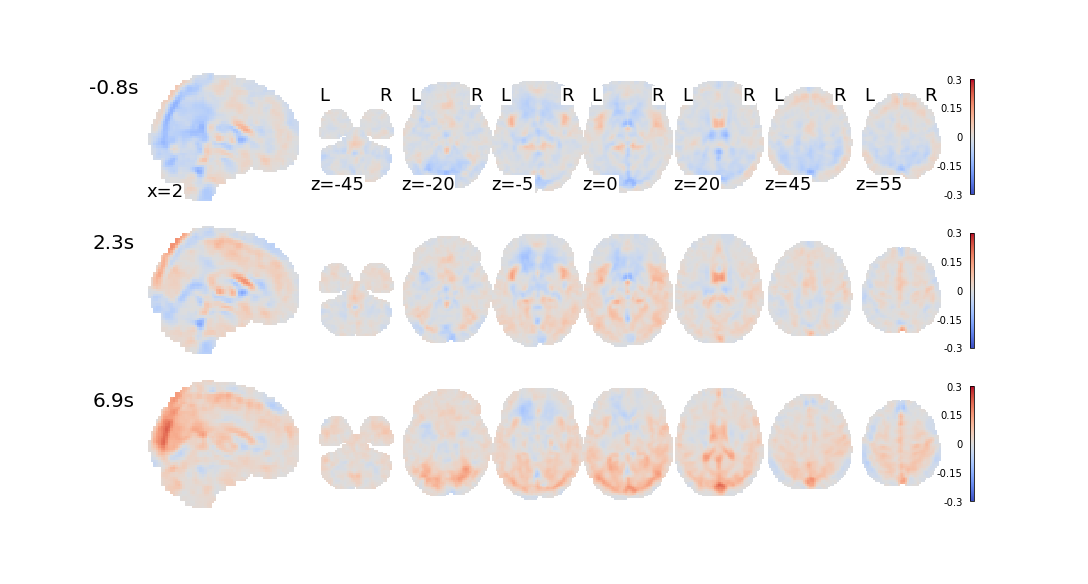
Using Nathan Spreng’s labs dataset, we’re seeing fairly robust patterns, even for the t2* and s0 effects (slightly attenuated relative to the optimally-combined & denoised data):
Optimally-combined and denoised pulse amplitude cross-correlation:
The pattern in the ventricles and posterior draining vein - negative in the s0, positive in the t2* - seem anatomically reasonable. This is the group-averaged effect (# of subjects: 87, # of sessions: 165). I’m guessing the large sample is averaging out some of the noise of volume-specific t2* and s0 estimation?