Dear Nilearn experts,
I have been using nilearn for functional connectivity analysis and it has been a great pleasure so far.
Now I have encountered what I believe to be a bug in the view_connectome function.
When plotting a connectome with solely positive correlation the view_connectome displays some of the connections as negative correlations. In contrast when using exactly the same input for the plot_connectome function the correlations are displayed correctly. So I assume this is a bug?
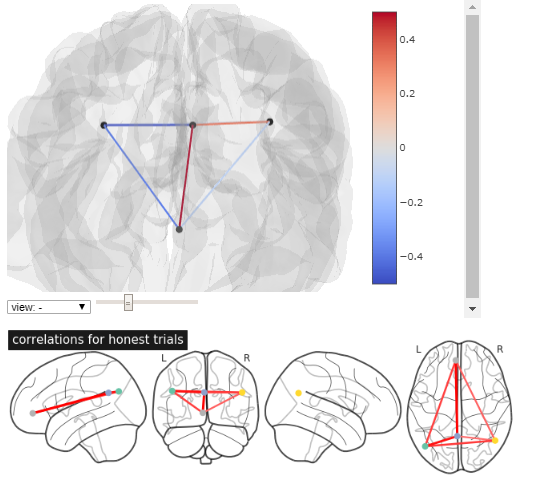
plotting.plot_connectome(r_honest[4:,4:], coords[4:,:], title=‘correlations for honest trials’,edge_threshold=0, display_mode=‘lyrz’)
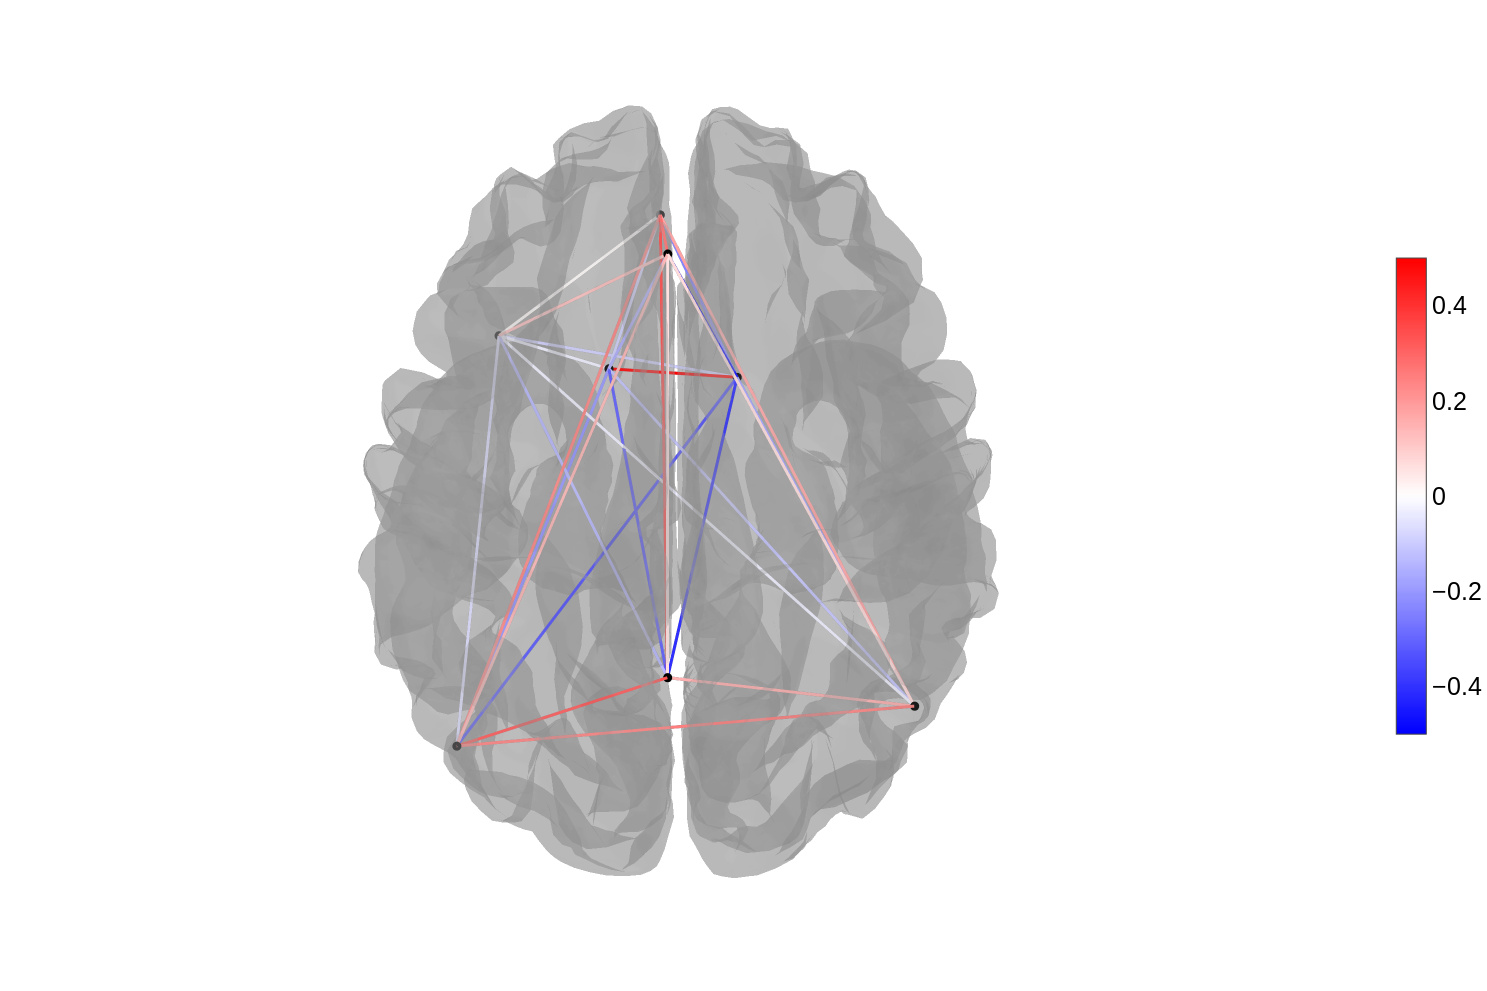
nilearn.plotting.view_connectome(r_honest[4:,4:], coords[4:,:], linewidth=5.0, node_size=5.0)
thanks! could you share the correlations and coordinates?
coords.txt (619 Bytes)
r_honest.txt (1.4 KB)
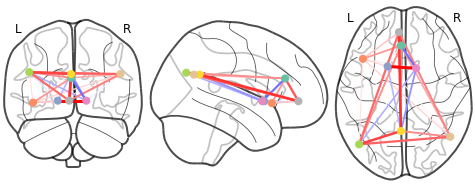
the r_honest.txt you shared does contain negative values. hence both plot_connectome and view_connectome correctly plot some edges in blue:
to reproduce:
from nilearn import plotting
import pandas as pd

coords = pd.read_csv("~/Downloads/coords.txt", header=None)
connectome = pd.read_csv("~/Downloads/r_honest.txt", header=None)

plotting.view_connectome(connectome.values, coords.values).open_in_browser()
plotting.plot_connectome(connectome.values, coords.values)
assert (connectome.values < 0.1).any()
assuming the files linked above are in ~/Downloads
Yes, however if you index the arrays or in your case dataframes as I did, only positive values remain and then the two functions return different results.
plotting.view_connectome(connectome.values[4:,4:], coords.values[4:,:])
plotting.plot_connectome(connectome.values[4:,4:],coords.values[4:,:])
which then results in the two plots shown in my first post.
indeed. removing nans in the connectome e.g. with connectome.fillna(0, inplace=True) fixes this problem
1 Like
Great, thanks for your help!
thank you, I’ll add a check for nans in the connectome in nilearn