Firstly I’d like to apologize for the bazillion posts I’ve put up in the past couple of weeks.
Your guys’ expertise and correspondence and patience is more helpful than you will ever know. I’m hoping as I get more familiar with this tool I’ll be able to help answer more questions then I ask.
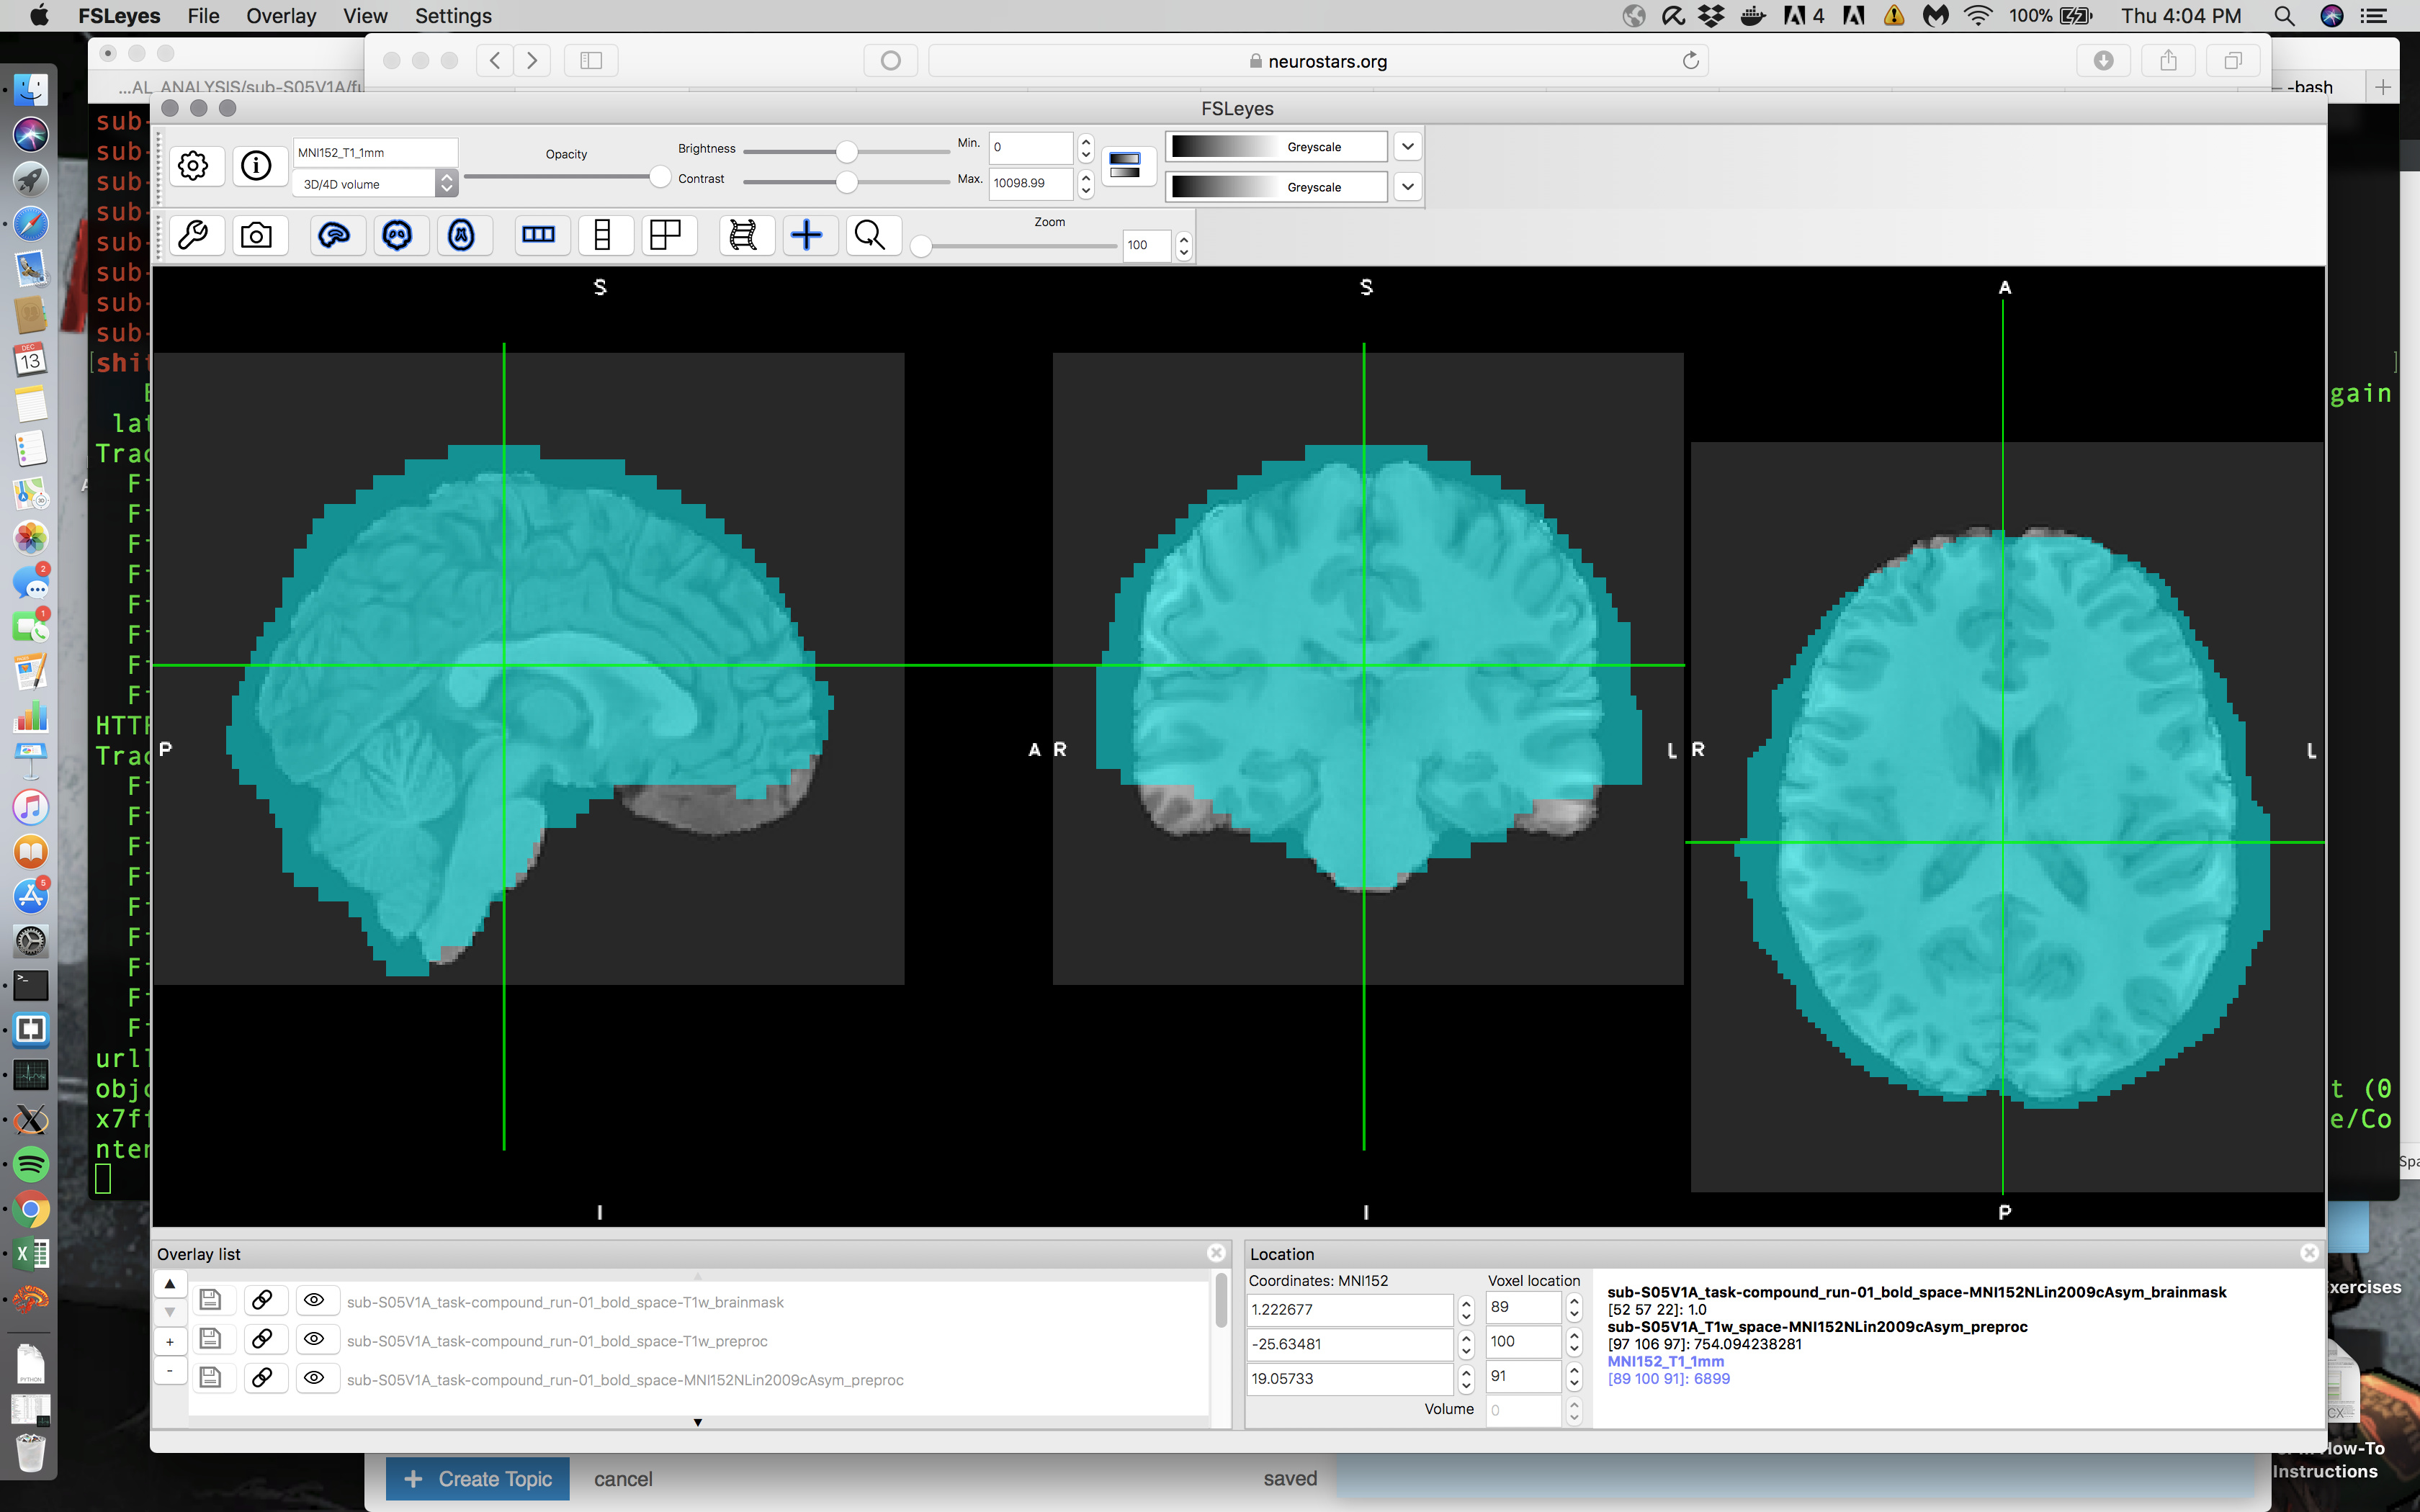
My Issue: When overlaying some of my EPIs on my skullstripped T1s in MNI space, there are some problematic boundary issues in some cases and smaller alignment issues in other cases. For all my participants my T1 skullstrip is basically flawless as is my T1 -> MNI alignment. My EPI -> T1 in native space is pretty good although I do see boundary issues on the right and left side. However the issue is most noticeable when you view the normalized EPI data on top of the normalized T1 or MNI as in the following screenshot.
To be honest I’m used to horrendous alignment so this actually looks a lot better than what I normally see without a bit of manipulation. However I’m not sure if this is ‘as good as I can expect’ or if I can do better; I’m particularly worried because I’m currently getting significant clusters outside of the brain here (posterior-ly). Can alignment be manipulated in FMRIPREP and should it be in this case?
As a ridiculously nuanced follow-up question, I’m not sure how familiar anyone is with AFNI. I’ve never used ANTs for registration before and had never even seen an .h5 file before using FMRIPREP. As an exploratory measure I wanted to use the T1 image in MNI space created from FMRIPREP (since it was amazing) and concatenate that transform with those created by AFNI for the BOLD data (i.e. 3dvolreg for motion correction and align_epi_anat.py for aligning the EPI to the original T1). I have no idea how to access ANYTHING in the .h5 file so just searched blindly until I found this post. Running these commands on my ‘T1w_target-MNI152NLin2009cAsym_warp.h5’ file does indeed give me 12 values that look like a transformation matrix so I used cat_matvec to concatenate this with the .1D files from 3dvolreg and align_epi_anat.py. Although this made sense to me logically the result was basically a vertical line. I suppose my question is, is there any way to use the transformation matrices outputted from FMRIPREP in other analysis softwares? I’m mostly doing this because I was solely an AFNI user before FMRIPREP and as I transition to the latter finding parallels in AFNI’s processing stream for as many steps as possible is helping me teach myself the new pipeline. So I’m really sorry for this bizarre question.
I can provide any data, review files, or anything else for the alignment question if that is necessary.
As always thanks for the amazing the fun new tool.
Lauren
Hmm… this could be an EPI masking issue or something to do with the viewer. Does this look the same when you use Mango? Could you share the reports (with pictures)?
PS Best split unrelated questions in to seperate threads.
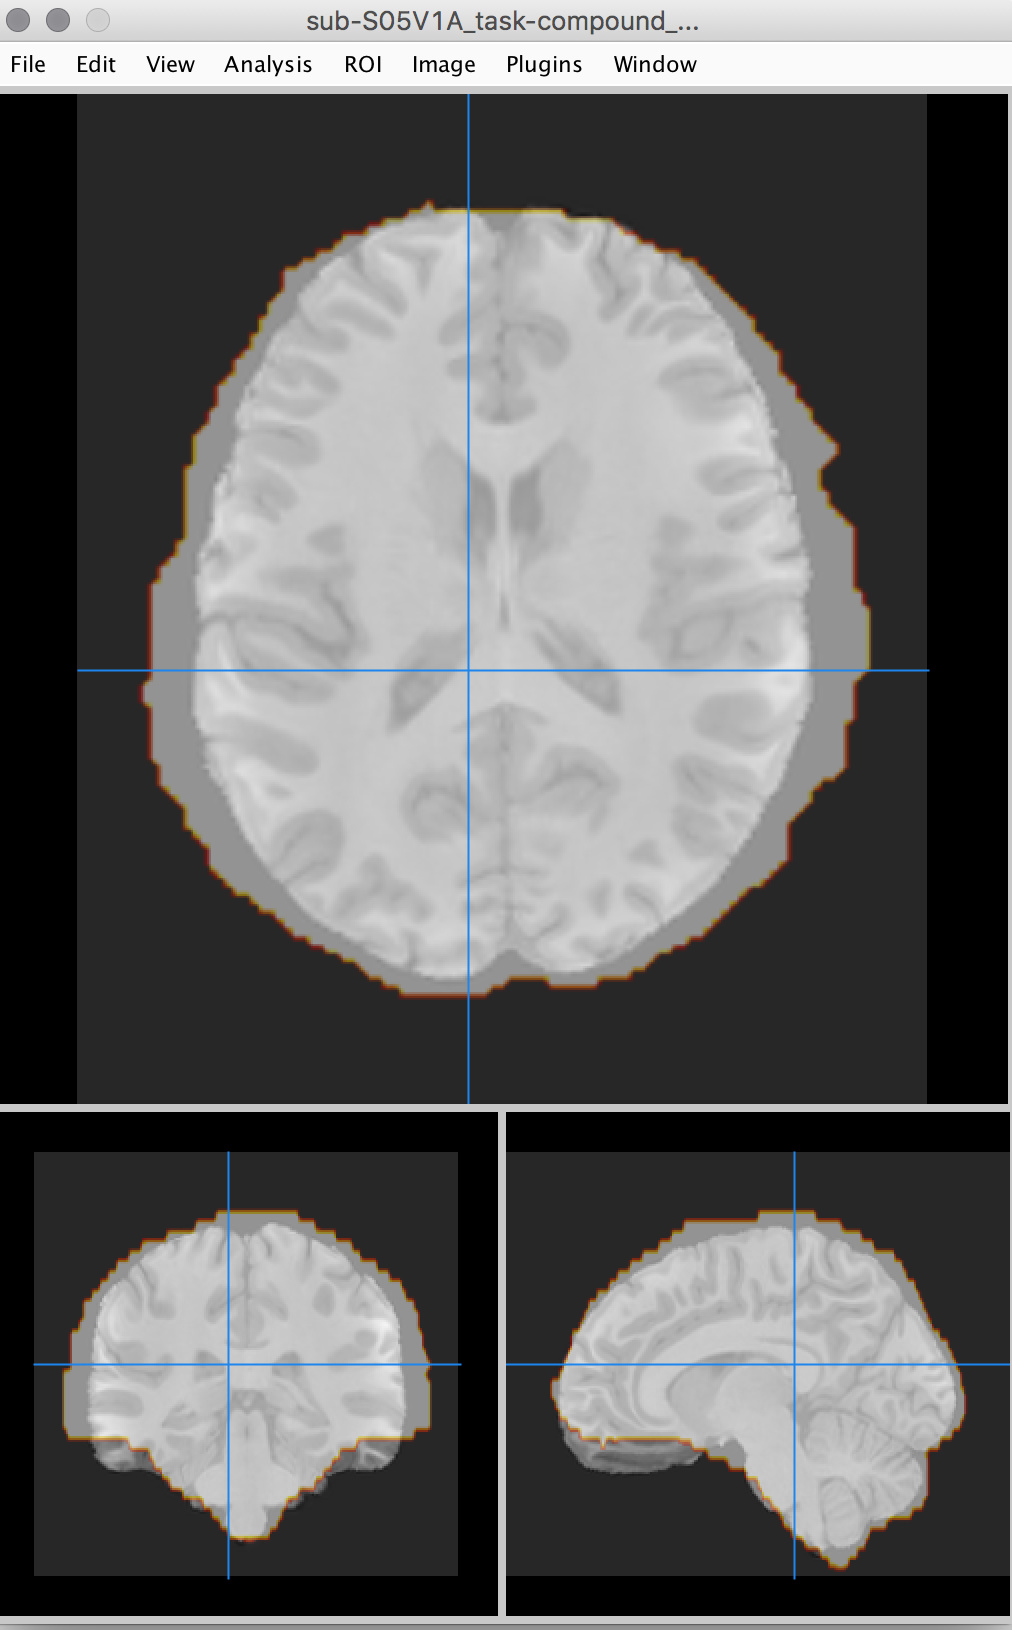
I’ve never used Mango so hopefully this is a sufficient reply but yes, it does seem to be a problem there as well as per this screenshot:
.
Hopefully the following link will work: The link is to the full folder of the subject which includes the report and figures file
Thank you so much for your reply.
(And I will make another post for my weirdo side question.)
EDIT: Oh fudge, the images are missing from the link. Let me rectify that.
EDIT: I’ve linked to the entire output folder instead. Hopefully this will provide more information but if there is a better way for me to present this to you, please let me know.
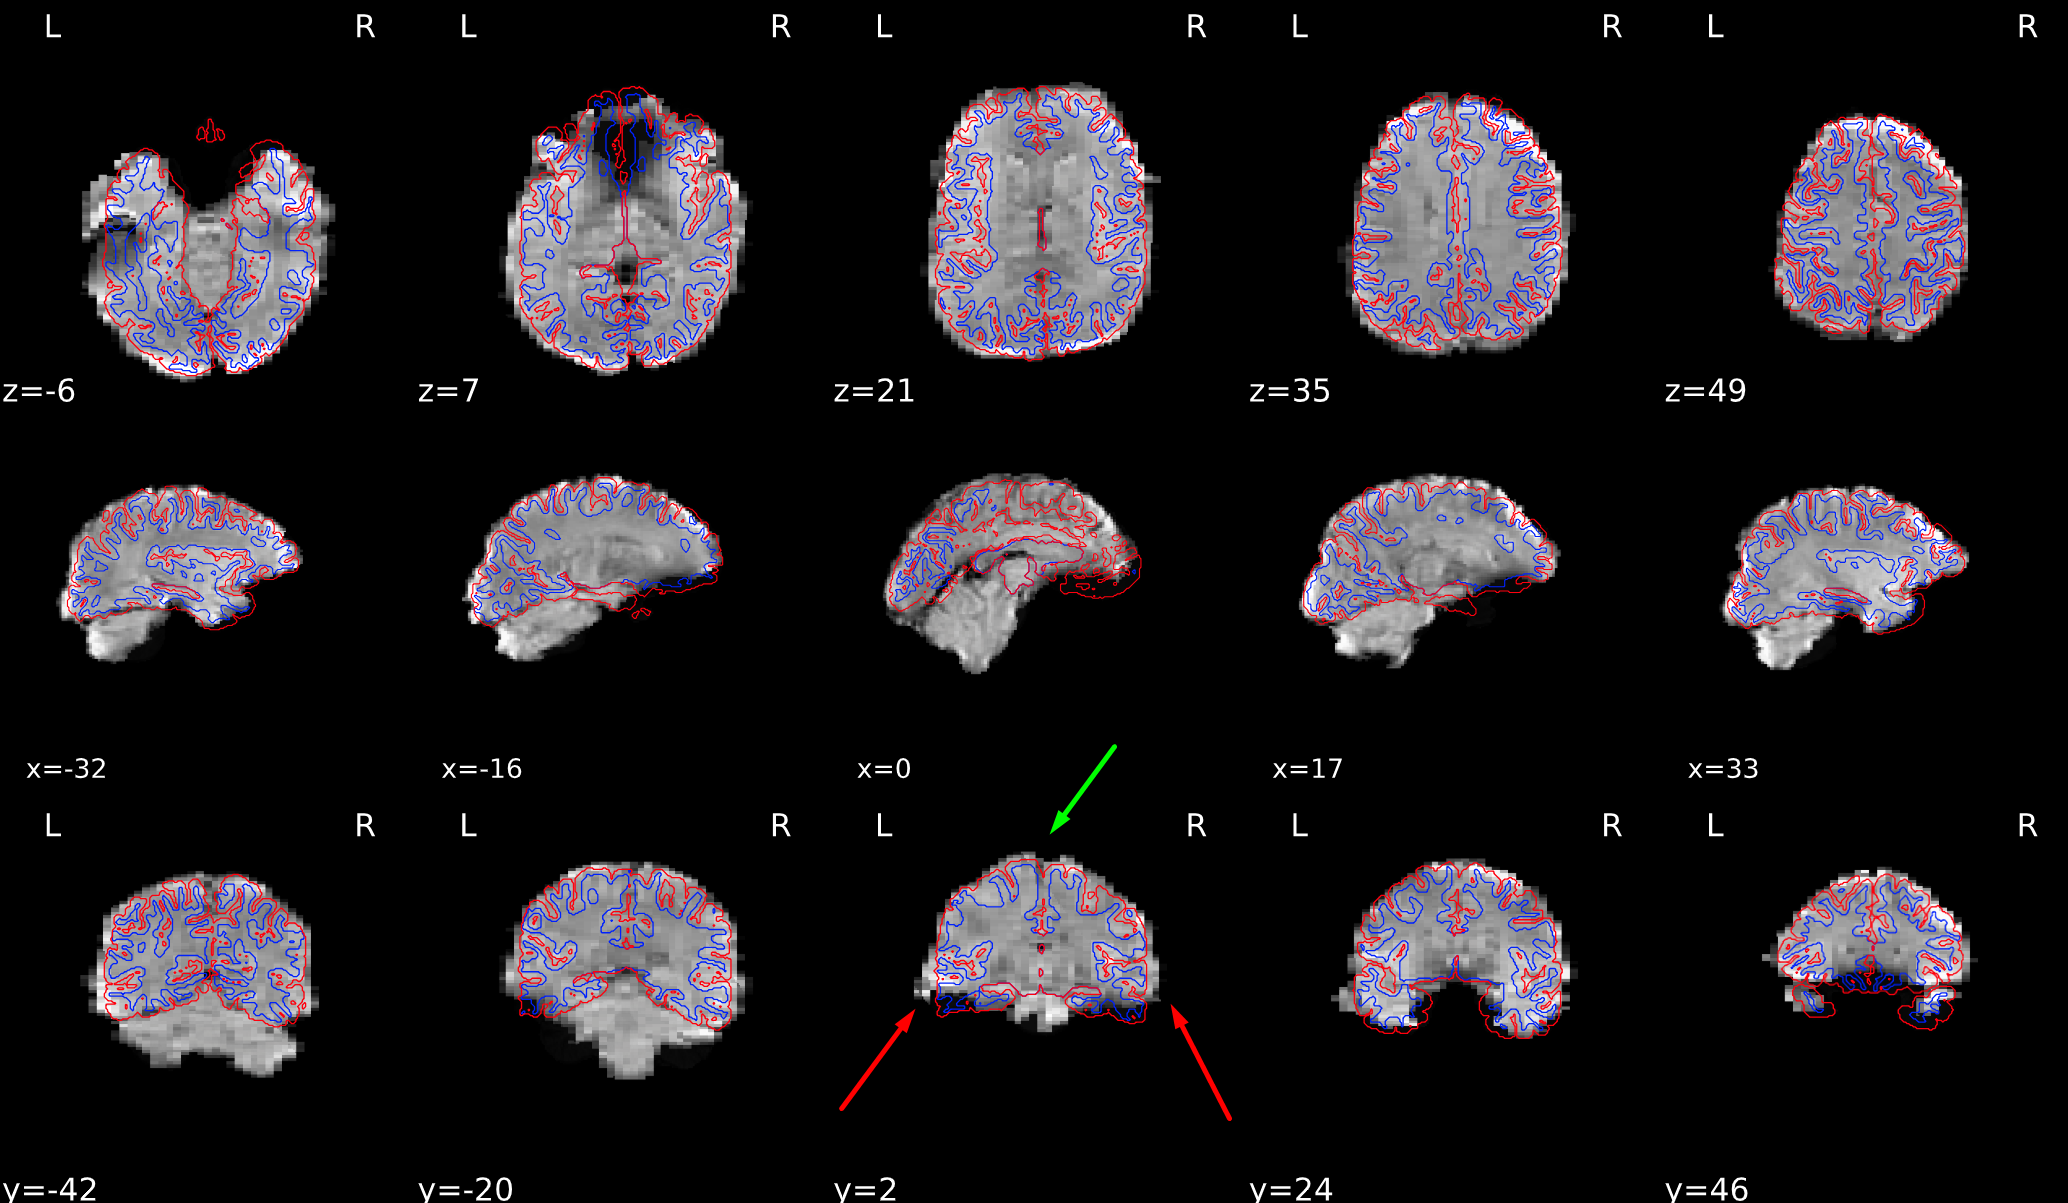
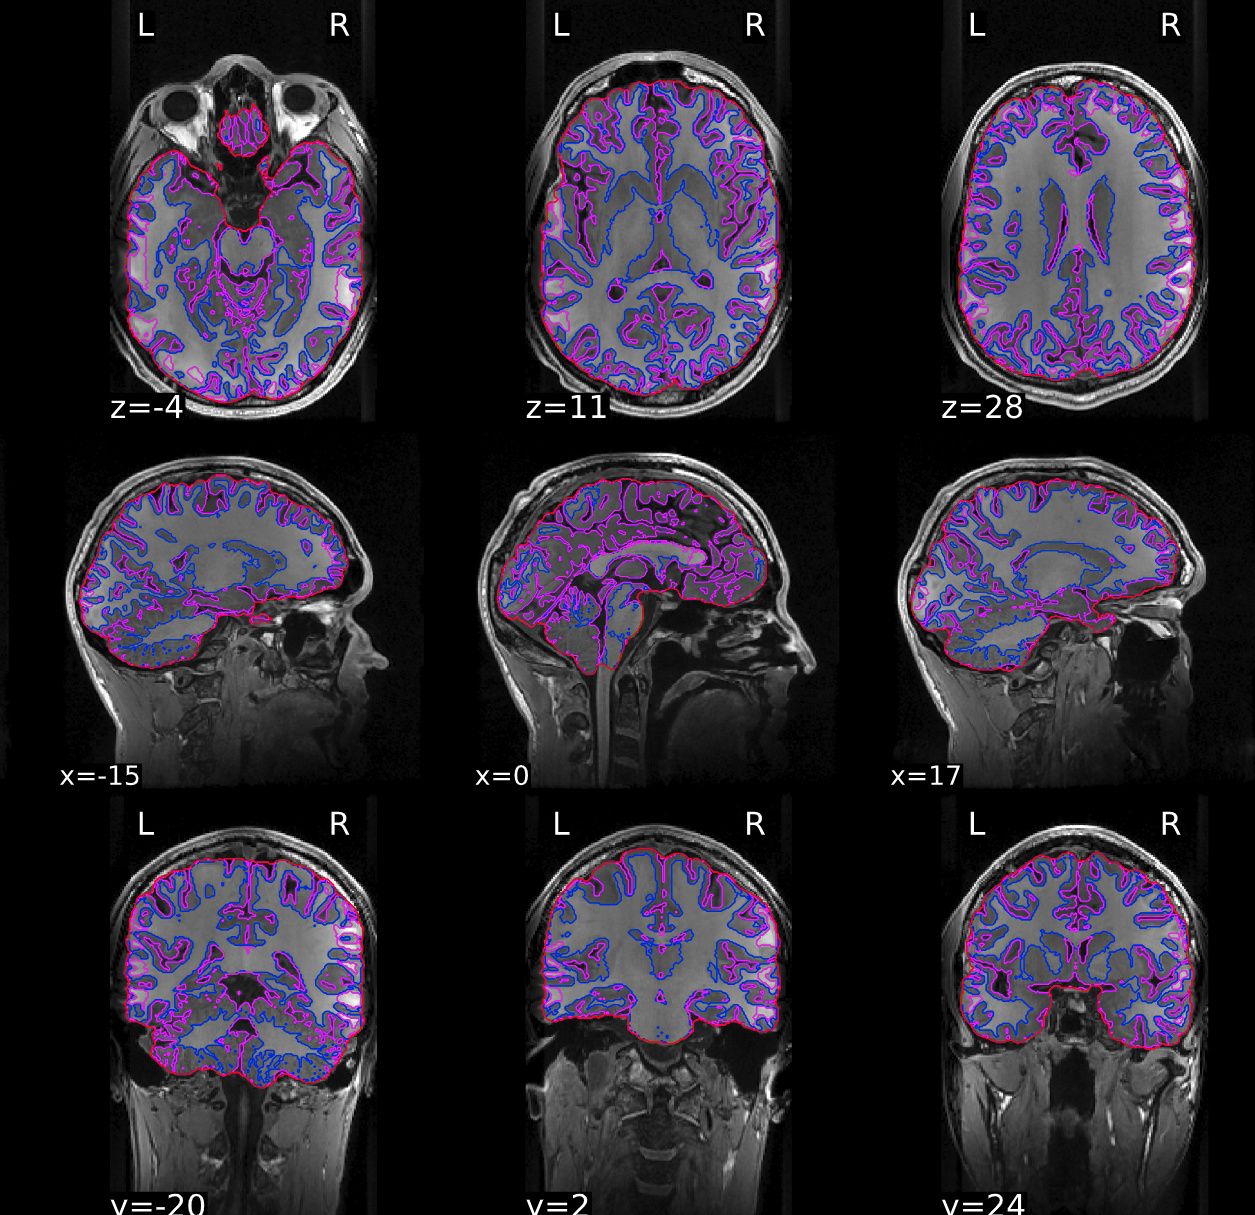
Thanks for sharing the report, It seems that there were no issues with the coregistration or skullstripping, but there are some very weird distortions visible in your bold and T1w data. Firstly bold images are disproportionally wider in the ventral part of the brain (but retain consistent shape with the T1w in the dorsal areas).
The discrepancy between T1w and bold dimensions might actually stem from the T1w volume which shows a lot of signal dropoff on the sides (perhaps the FOV was too narrow?).
Such distortions do not happen in normal data. First thing I would do is work with your scanner technicians and try to resolve those issues.
On the FMRIPREP one thing you can tweak to try to improve the coregistration are degrees of freedom. Try rerunning with --bold2t1w-dof 6 flag.
Thanks so much for taking a look at that Chris. I’m mostly used to looking at data in viewers like fsleyes or afni so did not notice that exact distortion. I’m really in debt to you for pointing that out and will discuss that with my tech asap.
I will rerun FMRIPREP with the new dof as you suggested. A quick question about that. I might be wrong but it seems like the usage page on the FMRIPREP site has changed since I last visited it so some of the commands are missing. I had planned to add a flag specifying the already run FreeSurfer data from the first fmriprep run to maybe speed things up but I cannot find that flag on the page anymore. Is that, 1) A good idea (or should I rerun the whole command) and 2) If it is, is there a place the rest of the flags are specified?
If it matters my original command was:
fmriprep-docker --fs-license-file /Applications/freesurfer/license.txt FMRIPREP FMRIPREP_OUTPUT/sub-S05V1A/ participant --output-space T1w template -w FMRIPREP_TMP/sub-S05V1A/ --ignore slicetiming --use-aroma --aroma-melodic-dimensionality 35 --ignore-aroma-denoising-errors --resource-monitor --low-mem
Thanks again, Chris, you’re an absolute lifesaver and I will report back my findings asap.
This should work, but you need to add the --bold2t1w-dof 6 flag.
Hey again Chris.
So it seems like the dof change made the functionals look slightly better but not significantly so. In the screenshot the blue/green in the EPI run with dof=6 and the yellow behind it was the old EPI. Thoughts?
Are you running susceptibility distortion correction? It seems to me that your images have L/R PE direction, and that overflow around the pial surface is just unaccounted-for distortions.
Hey @oesteban, thanks for the reply, this is still really bugging me.
I do not have fieldmaps, unfortunately. I see that FMRIPREP has an sdc_fieldmapless method which would seem to be my only option but a quick ‘find’ in my graph shows no ‘sdc’ text so I suppose I am not? implementing it? Given my command above is this an option I can add? I see this does its estimation via nonlinear registration; is a registration parameter something I need to modify?
I really appreciate your insight!
EDIT: I just found the --use-syn-sdc option. I will rerun. Thanks for the idea!
1 Like
Before you dive in, please make sure that I’m right and these data have L/R phase encoding.
Good looking out. In my .json file output from dcm2niix it says my phase encoding axis is ‘i’ and using 3dinfo from afni on my EPIs indicate my first (x) axis orientation is actually anterior-posterior. I think this means that’s the phase encoding axis, correct? Does this screw me out of this potential fix?
On the contrary, i means LR (unless the axes are swapped in the data array).
EDIT: I missed the second part about AFNI’s 3dinfo. Yes that probably indicates that your axes are swapped.
You’ll see still improvements with SDC. However, coming back to the report Chris posted, I would say that as he diagnosed, the T1 might just be not good enough.
This looks like a good candidate for EPInorm… Which is unfortunately not yet implemented in fMRIPrep.
Hey guys:
Sorry to resurrect this but I actually went and discussed my acquisition parameters with my scan tech who was of absolutely zero help with this issue. In the end I made the executive decision to add 10mm to the FOV in the L-R direction. Originally it was about 130mm L-R (which I now realize is way too small) and I was able to add 15mm to get it to ~145mm. We did not go for more because we had to change the voxel size to get a bigger FOV so my voxel size is now 3.5mm isotropic and going for even bigger would make it 3.8mm isotropic which I thought was too large. So in the end we added ~15mm to the FOV for the BOLD and T1 scans and also I started collecting pepolar scans so I can do distortion correction.
I ran FMRIPREP on my new data using the pepolar scans for SDC but wanted to check on something related to what I posted about originally.
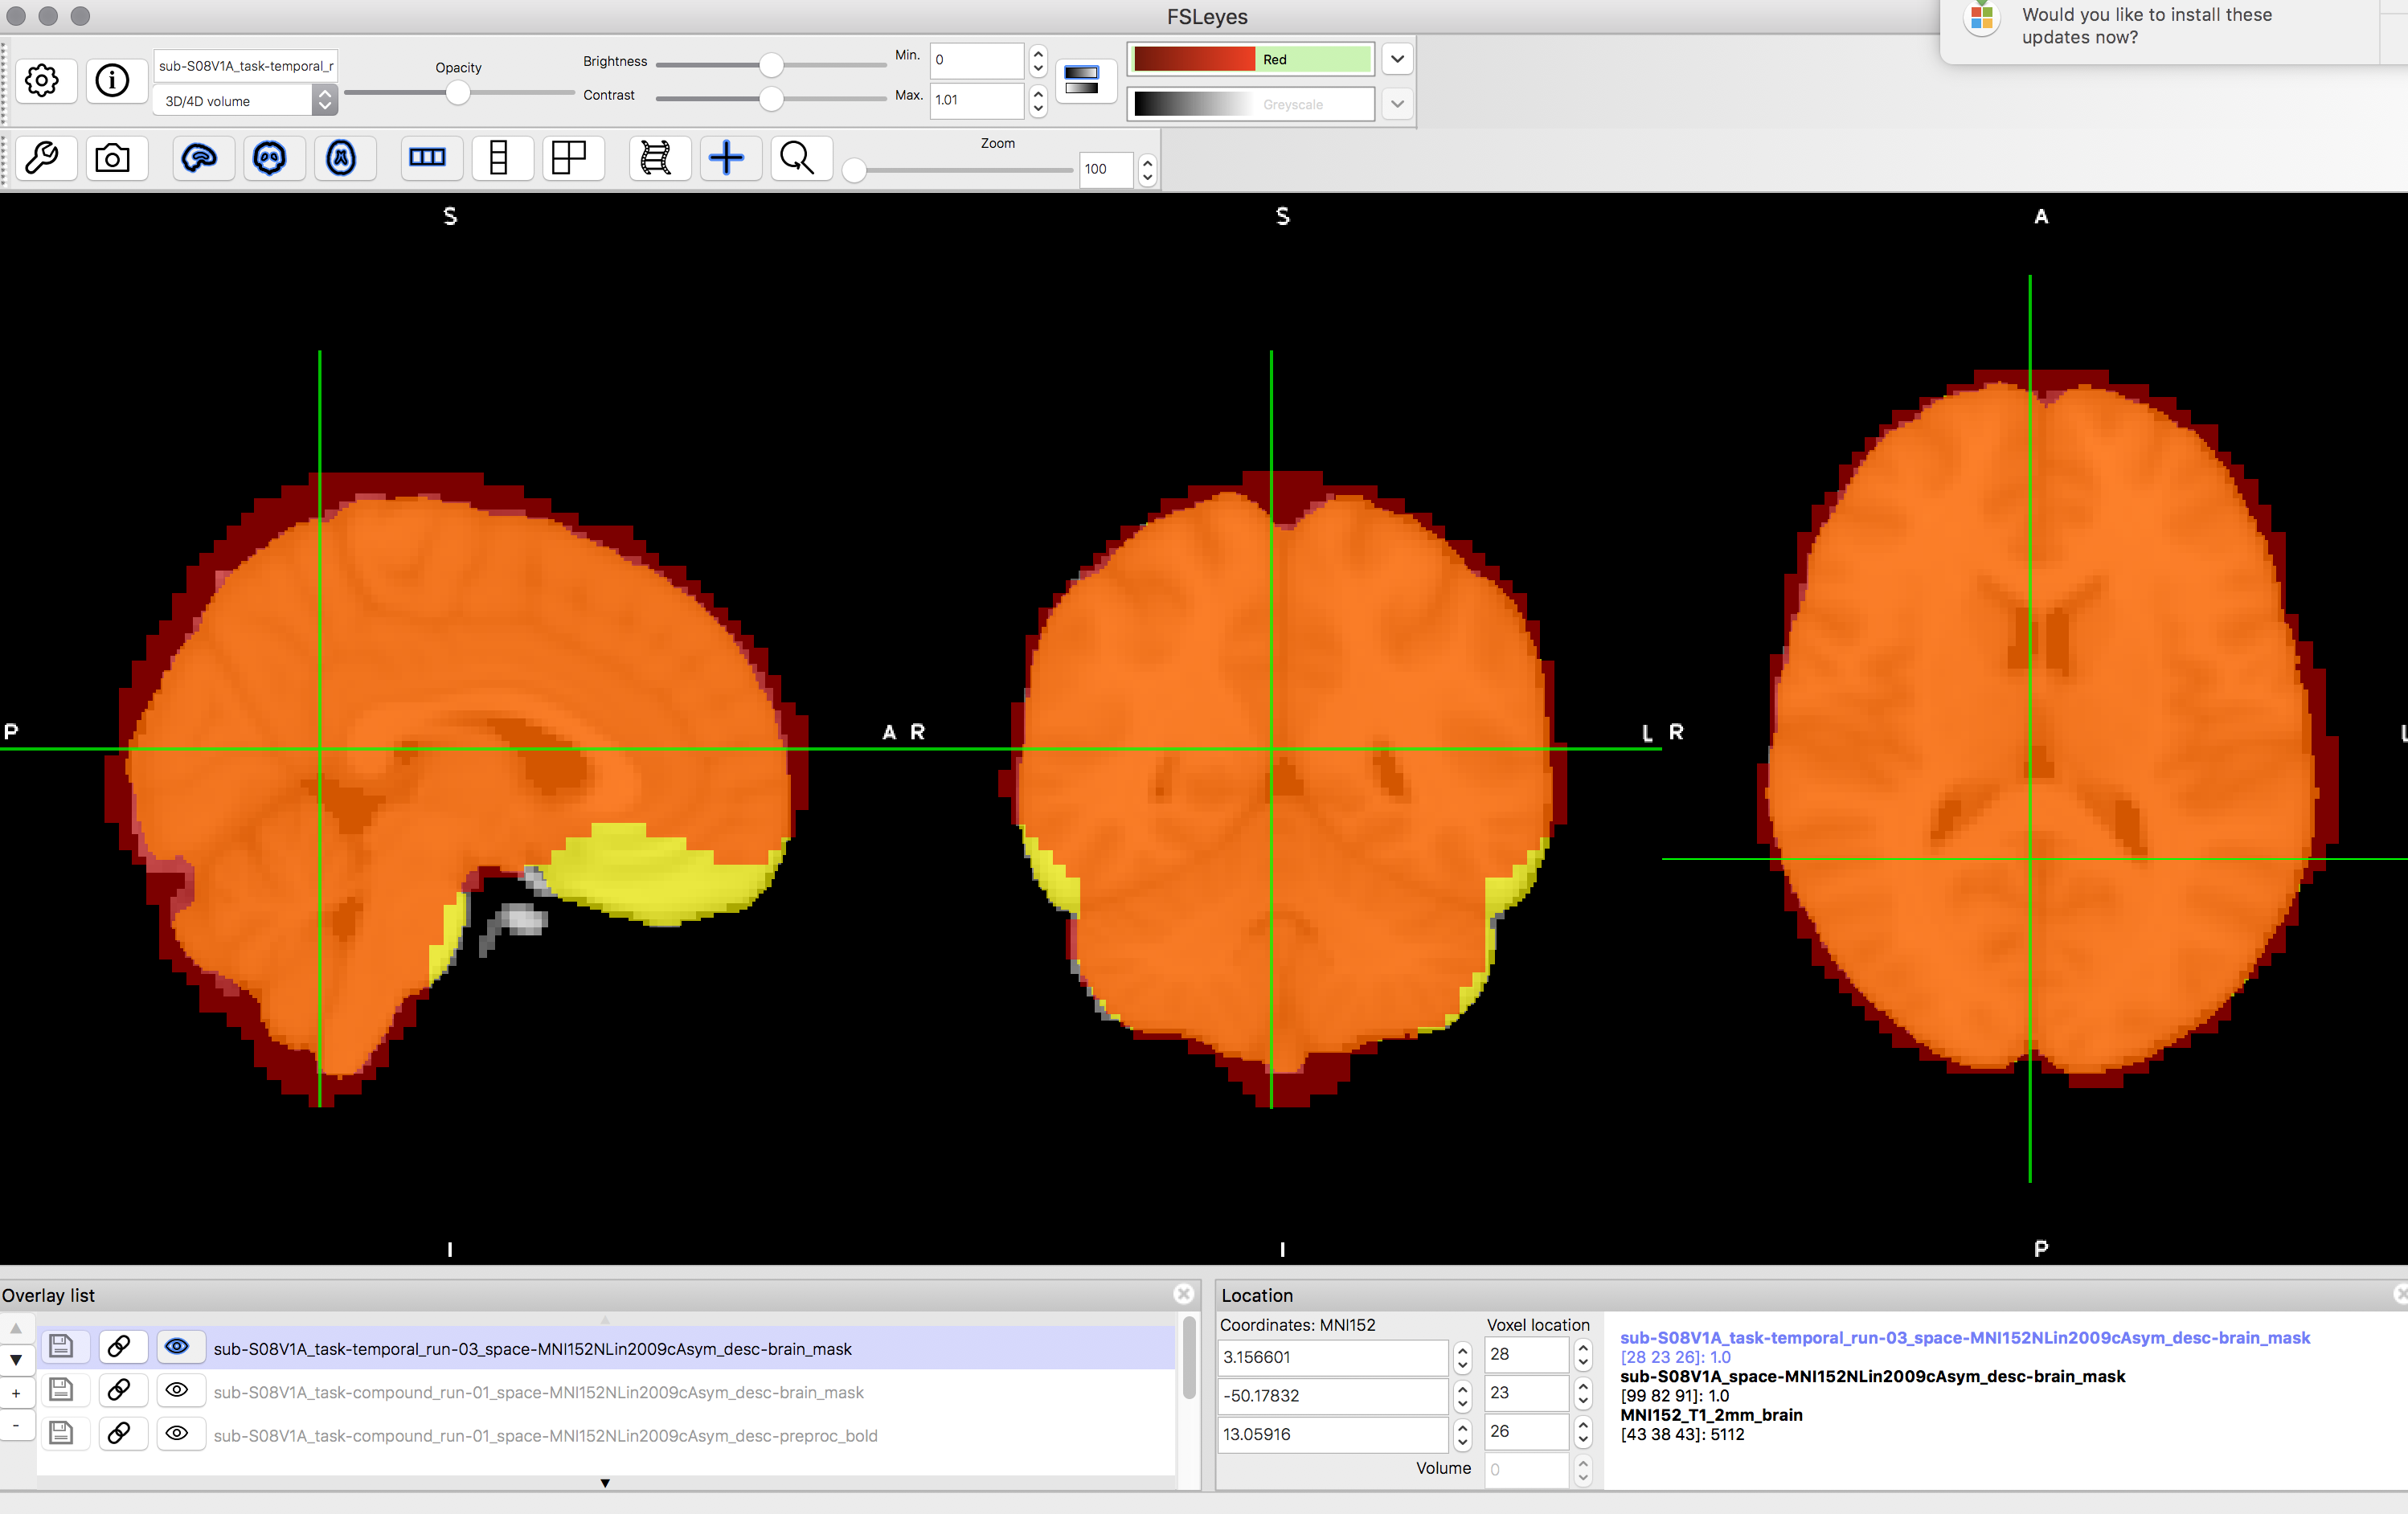
In this image the underlay is the 2mm MNI template. The yellow is the anatomy brain mask which, like before, is pretty perfect, and the red is one of the EPI masks. It definitely doesn’t have the same issues my original data had with spill-over on the left and right but there
does still seem to be some issue on the top and back (or a less pronounced masking issue generally). It’s visibly not as bad as it was but I’m curious as to if this is still problematic or, in your opinion, you’re like, “No, yeah, that’s pretty good.”
Looking at the FMRIPREP-generated output it looks like the distortion of the bold images ventrally isn’t there anymore (which is good).
I guess I’m not clear on what would continue to cause a masking issue (i.e. the FOV still isn’t big enough, etc.).
I’ve attached the output if that helps.
Thanks again guys!
Lauren
I’m sorry to carry bad news, but I think extending the FOV for the BOLD was not necessary. If you did not adjust the sequence to save time in some other way, acquiring more extent has probably reduced your phase readout time making your distortions more acute.
You did great extending the FOV of the T1 though. That was necessary.
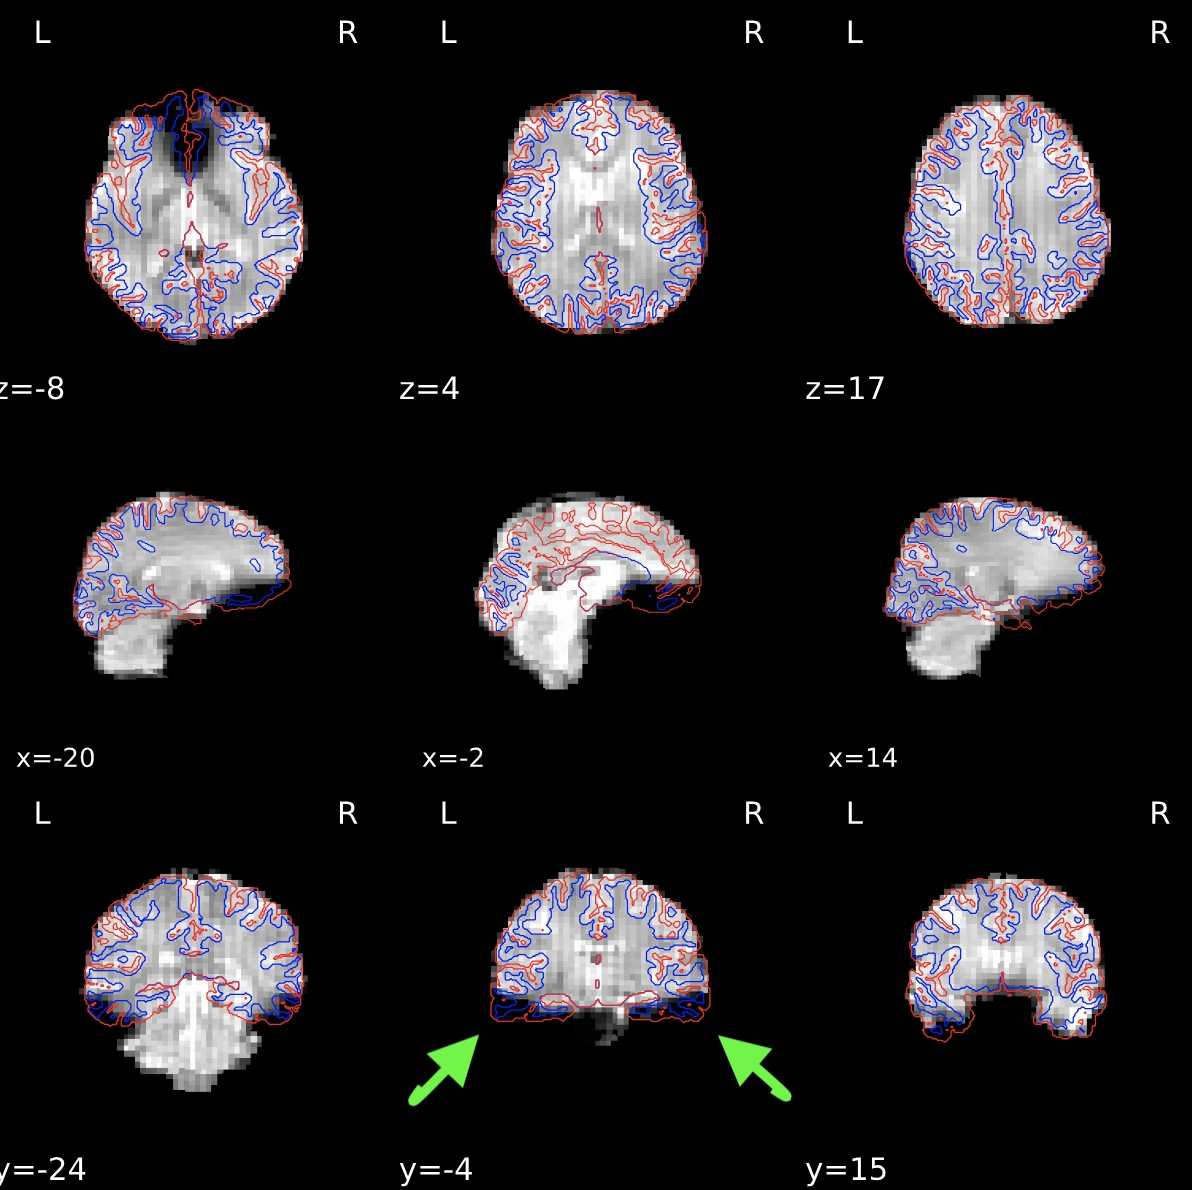
There are a couple of ideas that run into mind looking at your last plot:
- Where does the stripy pattern comes from in your axial view? That looks like a slice timing artifact but across the sagittal plane. It’s something I’d dig into.
- Dropout is just too much. You probably want to consider rolling your FoV prescription back (ONLY for the BOLD, your T1 now looks fine).
@oesteban thank you so much for this comment. In a stroke of good luck I read it as I am about to scan another participant tonight, so I am changing the BOLD FOV back to its original dimensions for this next individual. When we made the FOV change to the BOLD originally, the slice thickness, number of slices, and matrix size changed and while I’m not sure what phase readout time refers to exactly it has something to do with echo time and not necessarily TR, (which was not changed) so I’ll just take this to mean I’m worsening the distortions that are already present.
I am hoping this will also possibly fix the stripy pattern (which I also noticed) which was not present on the BOLD scans with the original parameters
Ultimately though I did notice one thing which is the new FOV gives better brain coverage for the BOLD as well as the T1 scans. Is it still worth using the original BOLD FOV parameters if they cut off a small part of the brain on the L/R?
I will update you on the new parameters.
I cannot tell you how much I appreciate your speed or correspondence - being able to make the change after 1 subject is a lifesaver.
Although convoluted, this is all true. Since the TR is fixed, you only have so much time to acquire a 3D volume. A 3D volume is again a series of 2D acquisitions that may, sometimes, happen in parallel, again, unrelated to these particular distortions or the readout time. Each 2D slice requires locating the signal along two dimensions, one of which is encoded by the phase. The time it takes to read one line of the phase encoding axis is that readout time I was mentioning. It is also called Echo Spacing (with is just a subtraction of two echoes). Anyways, the more voxels you want to acquire, the more time you’ll need, and thus, you had to make larger voxels (lower resolution) to fit all these timings.