Hi all,
I have noticed that this preprint by Eyre, Fitzgibbon, et al. relies on 30 independent components. When I try to replicate a similar analysis, I find some RSNs where each lateral part is in a different component (visual, and visual association, for example). Is there a statistically correct manner of stitching these components together, or should I retry the group ICA with fewer components?
I realise this is a general rs-fMRI question and not uniquely concerning the dHCP dataset, but unfortunately I haven’t been able to find related responses in the FSL mailing lists or forums.
Thank you in advance!
Diego
Hi Diego
The recommended approach when you are seeing splitting of components would be to reduce the dimension of the ICA.
Cheers, Sean
But if you have some matched L-R components, it is indeed possible to simply add them.
My 2c,
Bertrand
Thank you both very much for the answers. Do you maybe have any references in mind where this is discussed?
Cheers,
Diego
Hi Diego and Bertand
My concern with adding different maps is that there would be sub-threshold weights on the contralateral side and summing them could produce unexpected results. I suppose if you were using thresholded ROIs that do not overlap spatially then it might be OK…
Cheers, Sean
Hello Sean and Bertrand,
Thank you very much for your answers!
I just wanted to note in case it turns out to be useful for anyone finding this thread in the future, that reducing the number of components from 30 to 15 did clump together most bilateral networks but at the expense of losing one, so there is definitely a trade off.
Moreover, I would be wary of using a component count that is lower than the 20 or so typically described for adults.
Diego
Hi @seanfitz,
I keep trying to replicate this article. I am now getting the same components with a bit of added noise for small kernels (1-2 mm FWHM), but some get disconnected/combined when applying larger ones (3-4 mm). Do you know what spatial smoothing, if any, was applied? None is reported, unless I missed it.
Thank you very much in advance!
Best,
Diego
Hi Diego
I am not sure. I have previously used:
data were spatially smoothed (FWHM=3mm) using FSL SUSAN, with an intensity threshold of 75% of the contrast between the median brain intensity and the background
as per: https://www.biorxiv.org/content/10.1101/766030v4.full
I will email the lead author of the paper you refer to an enquire about the smoothing.
Cheers, Sean
Hi Diego
I had this response from the lead author of the paper you mentioned:
To define the networks, we didn’t apply any spatial smoothing.
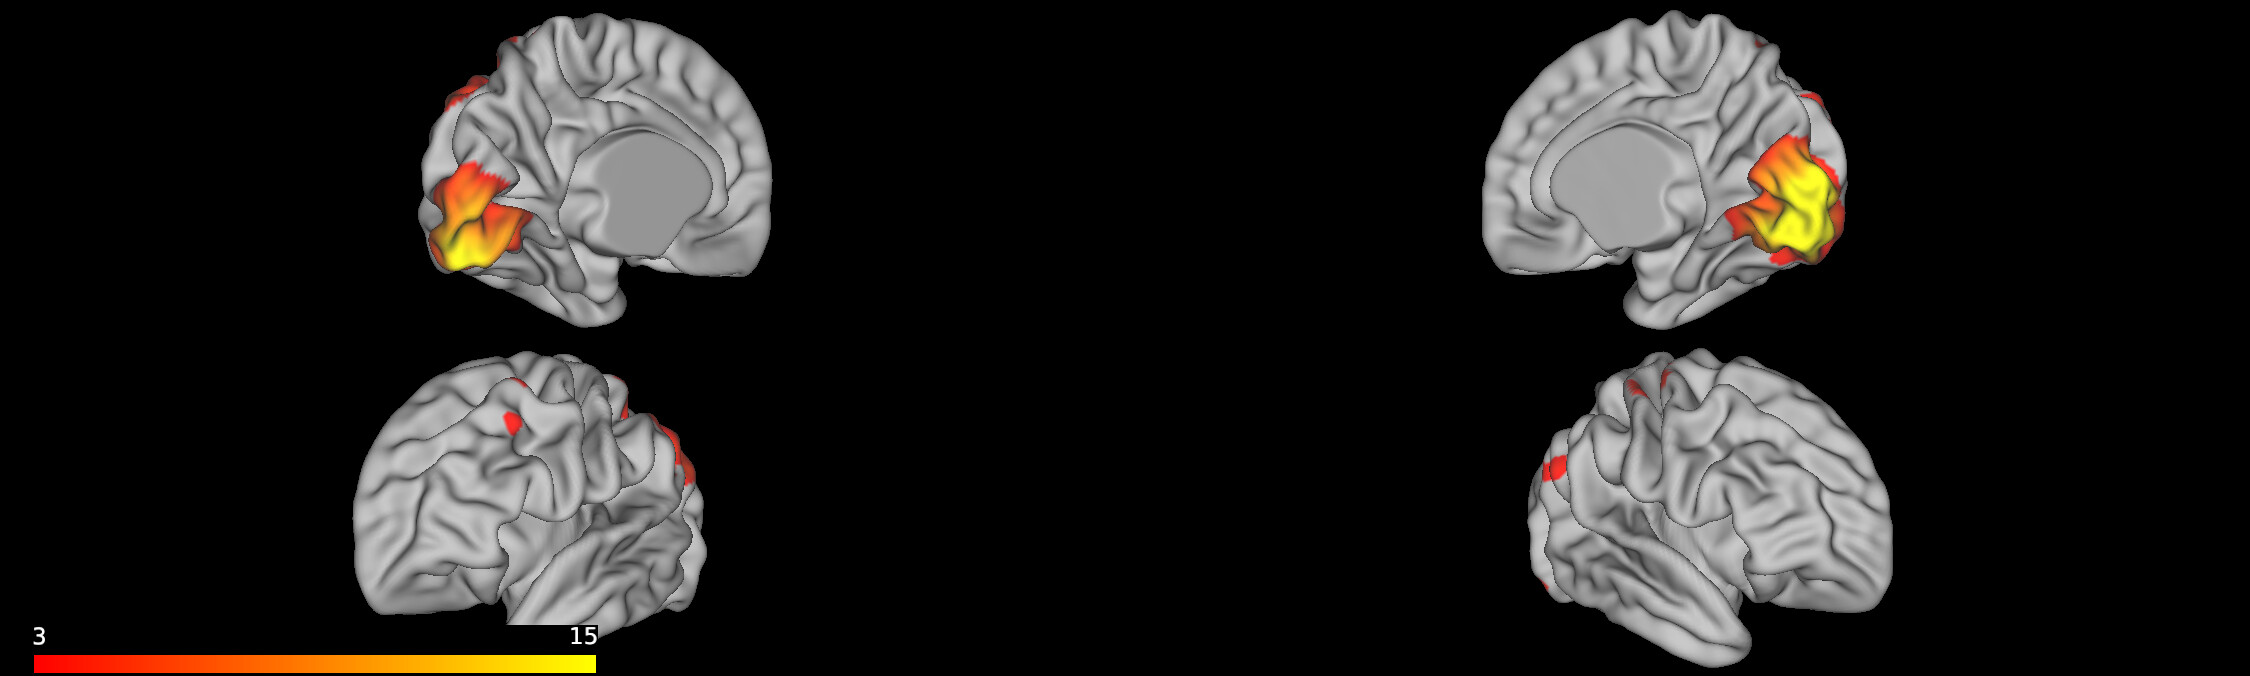
In the image displaying the networks parcellated on the cortical surface (Figure 1B) there was 2mm smoothing […] But this was just for visualisation of the already defined networks
I hope this helps.
Cheers, Sean
Thank you very much Sean! I wanted to make sure because my final group ICA turns out quite a bit noisier. I must be missing some other pre-processing step.
On a related note, when I tried to replicate the group ICA on the cortical surface by using your hcp_surface.sh I was never able to get the auditory RSN. I tried skipping the dilation and, even though the auditory network shows up, I now can’t reliable get the temporoparietal one. As a result, I am currently trying different (more conservative) parameters for the -metric-dilate.
My main suspect so far are the HCP values for distance (10 and 30 mm). I will try to change it and let you know if I get good results. I should mention that, counter to my expectations, I reliably found visual networks even though no ‘goodvoxels’ mask + dilate was applied.
Best,
Diego