Dear experts,
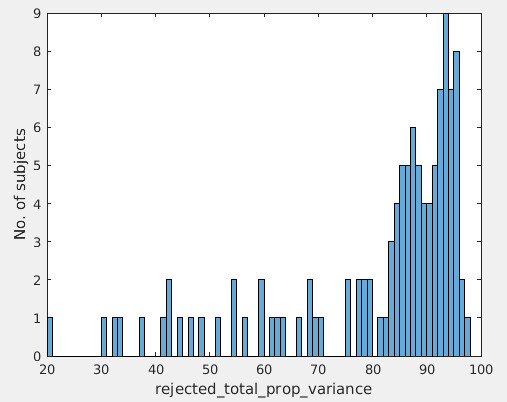
We are using tedana for denosing on our MBME data (TR=1s, TE=12ms, 29.75ms, 47.5ms, 3mm isotropic), but from our data, we found for most of the subjects, the variance explained by the accepted components is very low (around 10%), as you can see the variance explained by rejected components could be >90% in the following histogram.
The main concern of us is whether tedana removed some of the neural signals as noise. For example, some components also contains signals with frequency we are interested (0.009~0.08Hz), although they also contain noise signals. We are wondering if these components should be kept. We currently used the defualt settings of tedana. We are wondering if there are some parameters that could be tuned to have more accepted components, besides manually selecting the components. If yes, should these thresholds vary with different cohorts?
We also checked the FC matrix and the DMN seed-based FC map of one example subject (>95% rejected variance). The FC patterns are obviouse, but we are still not sure if the neural singnals all remains. Is there any QC step for the ICA denoising?
Could you please advise? Your reply is much appreciated.
Thanks and regards,
Xing
Hey @qianxing
This can be a tough question to answer, but I have a few questions that may get us started.
How are you doing your preprocessing? With fmrprep, afni,other?
Are you using an up to date version of tedana?
What are your full scanning parameters - I see some sequence details, but what is your field strength, head coil channels, GRAPPA/SENSE factor, and multiband factor?
Is this a group that you would expect to have a lot of motion?
Is this just resting state data? how many volumes are in one run?
QC for resting state can be very challenging, as it can be difficult to separate out signal and noise in the best cases. I believe this is a reasonable guide, Hand classification of fMRI ICA noise components - ScienceDirect, though it appears to be using FSLeyes. Maybe you can take a look at that and then compare that to some of the components selected as noise, even with the frequency band of interest.
If I am reading your graph correctly, then some subjects had 95% of the variance removed - which seems frightening, however, it isn’t too ridiculous as components associated with signal drift and motion can explain a tremendous amount of variance individually. It is hard to say if this is a bad thing or not.
In general I would use the same settings for all groups, out of caution. If you wish to dramatically alter the PCA->ICA step, you can try using the ‘kundu’ criteria for --tedpca. There are other options there that may also work, but I’m not sure which you used as we recently changed the defaults.
Hi @dowdlelt Thanks for your kind reply! Here are my answers to your questions:
1)I used this pipeline for my MBME data preprocessing: CBIG/stable_projects/preprocessing/CBIG_fMRI_Preproc2016 at master · ThomasYeoLab/CBIG · GitHub
The order of preprocess steps is: skip first 4 volumes → slice time correction → motion correction → spatial distortion correction → ME denoising using tedana → BBR registration → regression → censoring → bandpass filtering → normalization
2)We used version 0.0.11 of tedana. Should we move to the latest 0.0.12?
3)MBME data was aquired using SIEMENS 3T Prisma_fit scanner (32 head coil channels, GRAPPA accel factor = 2, Multi-band accel. Factor = 4).
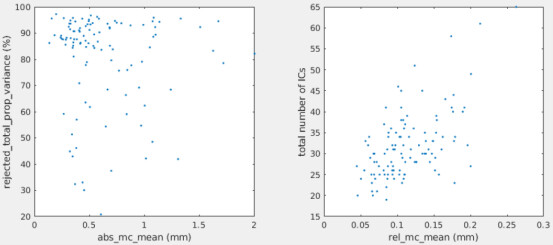
4)This group is the older adults. There is no obvious relationship between motion and variance explained by rejected ICs (see figure below, left: mean absolute motion v.s. total variance explained by rejected ICs), but it seems there is correlation between motion and total number of ICs (right figure: mean relative motion v.s. total number of ICs).
We also concerned the number of the total ICs (20 to 50 ICs, see the total number of ICs in the right figure below) is a bit low, as we will be working with very low data dimension after IC rejection. How do you think?
We also have another cohort which are young adults, but we have the similar findings (also tend to have very few number of ICs to begin with, few selected ICs and low variance explained).
5)Yes, this is resting state data. The time length is 10min20sec, with a TR=1000 ms.
Thanks and regards,
Xing
-
From what I could parse of your preprocessing, I didn’t see any obvious issues. It seemed that motion was estimated for one echo and applied to others. Just to confirm, spatial distortion correction is performed identically for each echo, correct? Not echo-specific? Does it seem like preprocessing worked well - if you watch movies of the data, it all looks reasonable? It does look like a mature processing pipeline, so I don’t think that is where the issue is, but always worth double checking. You may also want to inspect the optimal combination spat out by tedana, does that seem reasonable? (for exampe, no weird extreme values, motion is corrected, reasonably good contrast, etc).
-
I think it would be worth trying with the latest version, I think there is one large change there that will have an effect - specifically we switched the component selection criteria to default to a setting (aic) that should return more components. This could be useful for you, as I do find it a little strange that you get ~30 components on a dataset that has >600 volumes. I would expect many more, assuming I am understanding everything correctly.
-
That acceleration is certainly high, but not unreasonable. I don’t expect that to be the issue here.
-
that is useful, thanks - but as mentioned above it is strange that you get so few components in general. I think trying with the latest tedana version (or at minimum choosing the --tedpca aic option, tedana’s denoising approach — tedana 0.0.12+0.g863304b.dirty documentation) could be very useful here.
If you are willing to share the figures output from tedana for a few representative subjects, I would be willing to quickly look at them to see if something jumps out to me but my impression is that the previous default --tedpca mdl just gave far too few components in light of your >600 vols.
Hi @dowdlelt Thanks for the suggestions!
Here are my answers:
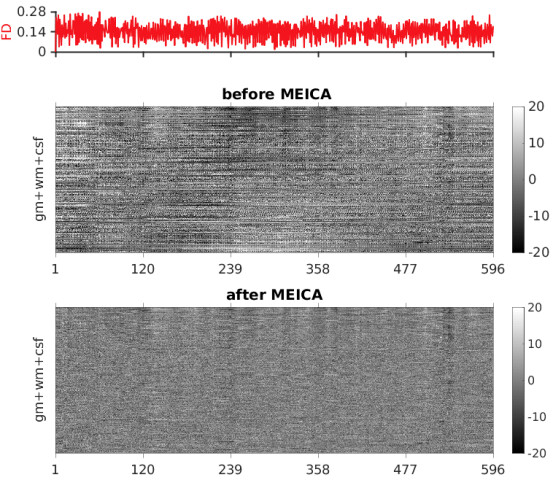
Yes, motion correction is only done on the first echo, and the DVARS and FD are computed based on the first echo only then apply the transformation matrices to the rest of echoes. Spatial distortion correction is performed identically for each echo, not echo-specific. Specifically, it is performed on the first echo, then applied to the other echoes. Yes, the movies of the data looks reasonable to me. We also checked the grey plots before and after MEICA (x: volume index, y: voxel intensity), and all seem reasonable.
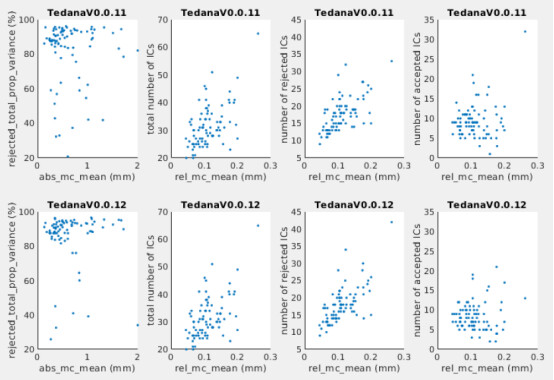
I have tried version 0.0.12 on 80+ out of these subjects. It seems the latest version didn’t increase the numbers of ICs (almost the same as 0.0.11, see the second column of figures below).
I am happy to share the figures with you. Let me know which figures you want to have a look and how to share. I can only add one picture in one post.
Thanks and regards,
Xing
(I uploaded this figure in a new reply since I can only add one picture in one post)
I am somewhat surprised that the number of PCs didn’t increase so much, but I would want to see the log/output from a tedana run to make sure I know what PCA selection criteria was used. Feel free to send that output as a direct message here (thats the tedana_YYYY-MM_etc.tsv file)
I think it would be worth trying with the option --tedpca kundu as that should (I hope) dramatically alter the number of comps.
For images - if you could share a google drive/dropbox/etc folder that has the tedana_report.html file and the figures folder that would be useful to look at. Maybe one from a good subject and one from one that has a very low number of PCs.
Hi @dowdlelt I have run Tedana V0.0.12 using different tedpca options, among which kundu is the least aggressive (kundu < kundu-stabilize < aic < kic < mdl (default)). The option --tedpca kundu dramatically increased the number of components, but the variance explained by the accepted components is still very low (last colume in the figure below, same for the other options).
Here is an example with subject ID of SINGER0105_V1. For this subject, although kundu increased the number of ICs, the variance explained by the accepted ICs dropped a lot. Options --tedpca kundu and mdl identified 338 and 23 components respectively, however the total variance explained by the accepted ICs is 1.6% and 71.4% respectively. Both options are run using V0.0.12.
Kundu:
subj_id abs_mc_mean rel_mc_mean accepted_total_prop_variance accepted_num_ics rejected_total_prop_variance rejected_num_ics ignored_total_prop_variance ignored_num_ics
SINGER0105_V1 0.266976 0.178343 1.64294164 5 86.61778199 92 11.73927637 241
mdl (default):
subj_id abs_mc_mean rel_mc_mean accepted_total_prop_variance accepted_num_ics rejected_total_prop_variance rejected_num_ics ignored_total_prop_variance ignored_num_ics
SINGER0105_V1 0.266976 0.178343 71.40734001 4 25.84773609 14 2.744923907 5
Tedana tsv files, html reports and the figures folders of the two options are uploaded into google drive: tedana_testing – Google Drive
I also uploaded a subject with ID of SINGER0009_V1, who has the most ICs using default setting, for your check.
Kundu:
subj_id abs_mc_mean rel_mc_mean accepted_total_prop_variance accepted_num_ics rejected_total_prop_variance rejected_num_ics ignored_total_prop_variance ignored_num_ics
SINGER0009_V1 1.71938 0.262554 19.57517127 47 73.47021104 79 6.954617696 206
mdl (default):
subj_id abs_mc_mean rel_mc_mean accepted_total_prop_variance accepted_num_ics rejected_total_prop_variance rejected_num_ics ignored_total_prop_variance ignored_num_ics
SINGER0009_V1 1.71938 0.262554 6.395176761 13 89.90504554 42 3.699777699 10
Please advise.
Thanks and regards,
Xing
if possible I may need to see the full data folders for these subjects. Just the inputs and outputs of tedana - anonymized epi data. I’ve looked at the component maps and the data seems strange.
Hi @dowdlelt Sure. I have uploaded the full inputs and outputs of tedana via the above link. Please check again. The input volumes are: /tedana_testing/SINGER****_V1_V0.0.12/SINGER****_V1_bld001_e*_rest_skip4_stc_mc_sdc.nii.gz (3 echoes)
The output folders of tedana are: /tedana_testing/SINGER****_V1_V0.0.12/cbig_output_TedanaV0.0.12****. The tedpca options are indicated in the folder names.
The tedana denoising output data is: /tedana_testing/SINGER****_V1_V0.0.12/cbig_output_TedanaV0.0.12****/SINGER****_V1/bold/001/SINGER****_V1_bld001_rest_skip4_stc_mc_sdc_me.nii.gz
The tedana denoising intermediate files are in /tedana_testing/SINGER****_V1_V0.0.12/cbig_output_TedanaV0.0.12****/SINGER****_V1/bold/001/ME_intermediate
Regards,
Xing
Thanks for sharing these - and apologies for the delay in responding. I have not had a chance to look at these in depth, but for on of them there is still considerable motion left in the volume data (for example, in the combined time series). This is not to imply that motion correction failed, but that the motion was so extreme that it could not be corrected. It almost seems as if the participant was in constant low level motion + multiple sudden spikes, which would be the worst case scenario for getting good fMRI signal. It does mean that using stats from motion parameters could be misleading. I will have to look at it more and see if I have any more ideas. I am surprised that using kundu didn’t lead to at least a few more components being accepted (given the huge increase in the # of PCs in general).
At the moment I am out of ideas other than an untested and never validated approach of lightly smoothing the data (say 2mm or 3mm? I’m not sure but needs to be a small amount) before passing it to tedana. It just seems that coherent signals are not being found, so that may improve your odds, but it is not a tested method…
As I said though, I will try and look again once I’m passed some deadlines.
1 Like
Hi @dowdlelt Do you have any further thoughts about our issues? Your help is appreciate.
