I would like to plot my statistical image using nilearn.plotting.plot_glass_brain. Two notes that might be related to my question:
First of all, my image is not in MNI152 space, which according to the documentation of nilearn.plotting.plot_glass_brain should be the case in order to “to work properly”.
Secondly, my statistical image is restricted to grey matter area only, so the output plot should handle this.
When I use nilearn.plotting.plot_stat_map, everything works as expected. White matter areas in the center are ‘left blank’:
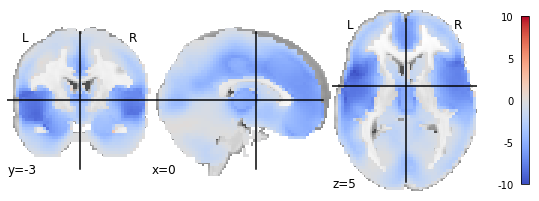
However, when I use nilearn.plotting.plot_glass_brain, I get the following output:
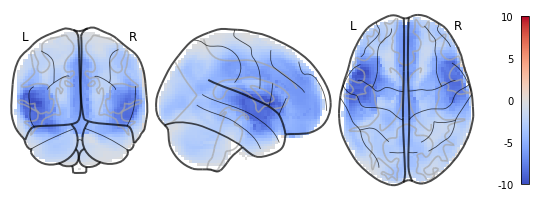
This is, of course, misleading, as it suggests that there are values in white matter areas, where there aren’t any.
In general, I also noted that I had to change and add some keyword arguments to nilearn.plotting.plot_glass_brain in order to give similar results to nilearn.plotting.plot_stat_map, which made me wonder, why the two functions differ so much in their default settings when naively spoken, the only difference between the two is the background image?
Here’s my code:
# plot statistical image
plotting.plot_stat_map(csz_unthresholded,
                       colorbar=True,
                       symmetric_cbar=True,
                       cmap='coolwarm',
                       cut_coords=[0,-3,5],
                       threshold=1e-6,
                       )

# plot statistical image
plotting.plot_glass_brain(csz_unthresholded,
                          colorbar=True,
                          symmetric_cbar=True,
                          cmap='coolwarm',
                          cut_coords=[0,-3,5],
                          threshold=1e-6,
                          vmax=10,
                          plot_abs=False)