Summary of what happened:
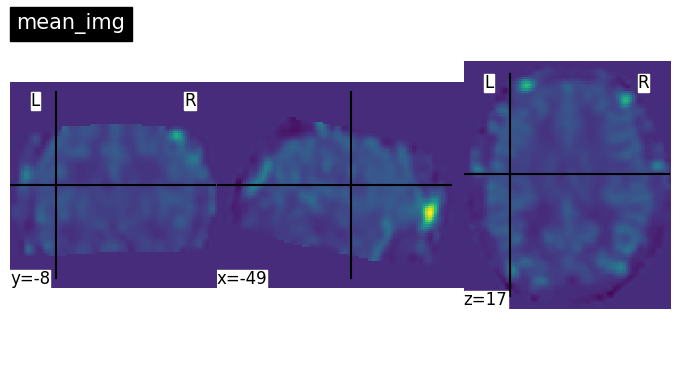
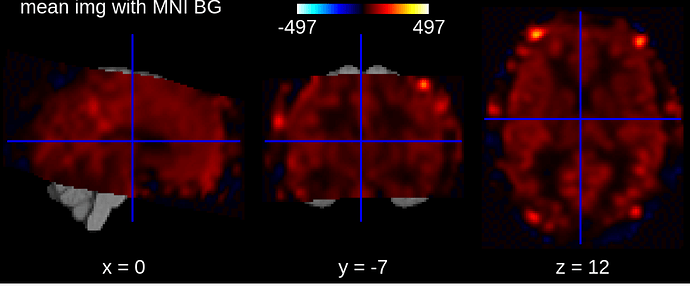
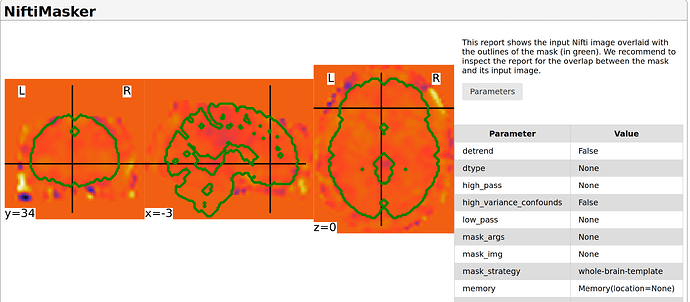
I have some preprocessed fMRI timeseries that are aligned in MNI space. I ultimately want to extract timeseries from regions based on an atlas (using MultiNiftiMapsMasker), but the generate_report() function does not seem to work for me (edit : see the reply below). In the meantime I just want to know that I extract the data correctly before further analyses. Hence, I use the NiftiMasker() and its report. As images show below, when plotting mean image onto the MNI template, it seems aligned, but when the computed mask using NiftiMasker with MNI template seems too small for the data. I dot not have access to a mask from the preprocessing output.
Command used (and if a helper script was used, a link to the helper script or the command generated):
from nilearn import image
func = nib.load(func_path)
mean_img = image.mean_img(func)
print(mean_img.shape)
plotting.view_img(mean_img, bg_img='MNI152', title='mean img with MNI BG').save_as_html('mean_img.html')
plotting.plot_img(mean_img, title = 'mean_img',)

voxel_masker = NiftiMasker(
    mask_strategy = 'whole-brain-template',
    smoothing_fwhm = 6,
    verbose=5,
)
voxel_masker.fit(func)
voxel_masker.generate_report().save_as_html('masker_report.html')
Version:
Nilearn version: 0.10.2
Environment (Docker, Singularity / Apptainer, custom installation):
ran on venv
Relevant log outputs (up to 20 lines):
(91, 109, 91) # shape mean_img
Screenshots / relevant information:

In the second image, we see that the image is normalized in MNI space, but the signal slightly look out of the template in the frontal areas. I wonder if there are ways to ‘trust’ that this signal could be remove (hence the masker report would show accurate information ?), assuming that the images are correctly registered in MNI space.
I tried many alternatives, like different parameters for mask_strategy in NiftiMasker(). I also tried to compute a binary mask from the MNI template (from nilearn.datasets import load_mni152_brain_mask), and to apply a threshold on my images.
More globally, I am really looking for ways to efficiently look at the data to make sure I can proceed with subsequent statistical analyses. Corollary questions (that I could address in another post if more relevant) would be :
- Is it better to compute the masker from all my timeseries from all participant at one (by concatenating all participants’ 4D images)?
- Are there other ‘diagnostic’ for data processing other than masker_reports and plotting images (how to proceed when having lots of data from different subjects?)
Thank you very much for any input!
Best,
Dylan

