I am currently working with the Gordon atlas and I have encountered a bit of a challenge. I have a list of ParcelIDs (333nodes,1-333 numbers, red in fig), but I am struggling to find a way to map these ParcelIDs to the corresponding ‘annot’ labels in the ggseg(colourful in fig, eg, CinguloOperc_1, Default_21…).
Thank you for your prompt response.
I have updated the original post to include this information. Your assistance in this matter is greatly appreciated.
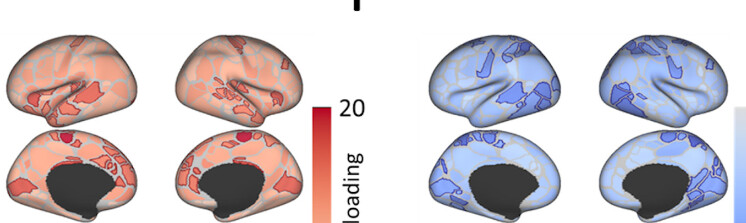
My goal is to visualize the values of 333 nodes (Gordon atlas) by mapping them onto a brain plot. Specifically, do you happen to know the method used to create brain maps like the one shown below?
Any guidance or advice on this would be very helpful.
The first spreadsheet originates from the website of Dr. Evan Gordon’s lab, who is the author of the Gordon atlas. This particular resource provides detailed information about the Cortical Parcellation as described in Gordon et al. (2016), Cerebral Cortex (https://www.mir.wustl.edu/research/research-centers/neuroimaging/labs/egordon-lab/resources/). The Gordon atlas comprises 333 cortical parcels, and the first spreadsheet includes the ParcelIDs for these 333 nodes.
Hi, I am facing a similar issue, and the ggseg:Gordon gitrepo also has this issue which has not been solved since October 2024, Were you able to solve it, or is there another package or repo in R or in Python which we can use to get these ?