Hi,
I have 140 nii files each file has the shape (64,64,36,1) and I would like to create one nii.gz file with (64,64,36,140) shape to build time series and functional connectivity matrix
Thanks in advance.
Hi,
I have 140 nii files each file has the shape (64,64,36,1) and I would like to create one nii.gz file with (64,64,36,140) shape to build time series and functional connectivity matrix
Thanks in advance.
Hi @Ibrahim_salim –
Have you looked at nilearn’s concat_imgs ? You can see an example usage in this example.
HTH,
Elizabeth
Hi @emdupre -
Thank you so much for quick reply. I’ve used concat_imgs and it worked well. The problem came with generating time series. I used the command
time_series = masker.fit_transform(the name of nii.gz file)
and I got the error :
BoundingBoxError: The field of view given by the target affine does not contain any of the data
Any help please?
Thanks
It sounds as though nilearn thinks your files don’t contain data in the field-of-view.
When you try plotting the individual files using something like nilearn.plotting.plot_epi, are the resulting images as expected ? You could adapt this example for plotting to loop through the volumes in your concatenated time series (or a subset of them !).
Can you also share your nilearn version ?
Thanks @emdupre —
I used your example for plotting. My nilearn version is 0.7.1. Actually I’d like to generate a functional connectivity matrix for each subject but it looks like wierd.
I used the code :
from nilearn import datasets
dataset = datasets.fetch_atlas_harvard_oxford(‘cort-maxprob-thr25-2mm’)
atlas_filename = dataset.maps
labels = dataset.labels
from nilearn.input_data import NiftiLabelsMasker
masker = NiftiLabelsMasker(labels_img=atlas_filename, standardize=True,
** memory=‘nilearn_cache’, verbose=5)**
time_series = masker.fit_transform(‘subject1.nii.gz’)
from nilearn.connectome import ConnectivityMeasure
correlation_measure = ConnectivityMeasure(kind=‘correlation’)
correlation_matrix = correlation_measure.fit_transform([time_series])[0]
import numpy as np
from nilearn import plotting
np.fill_diagonal(correlation_matrix, 0)
plotting.plot_matrix(correlation_matrix, figure=(4, 4), **
** vmax=0.8, vmin=-0.8)
where subjject1.nii.gz is the first subject. the functional connectivity was
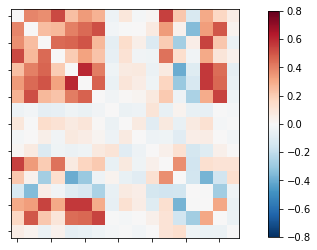
the shape of the correlation matrix was 17X17 which is weird !!.
So far you only plotted the correlation matrix. Since @emdupre already mentioned that your files might not contain data in the fov, you should create a plot of every single image in your data and check them visually  This might explain the missing ROIs.
Thank you so much @mibur for your advice. I found the solution by doing image registration for all the images and I avoided using concat_img command. Also, I used another type of atlas.
Regards
MANAGED BY INCF