I’d like to use MRIcroGL to plot some images I made that are based in MNI152NLin2009cAsym. Furthermore I’d like to use the mni152 template that comes packaged with MRIcroGL (for details on the template see MRIcroGL/Resources/standard at master · rordenlab/MRIcroGL · GitHub).
While its not completely clear to me from the github description exactly what space mni152 template is in I did notice that one of images seems misaligned where activation is crossing through empty space, I believe that perhaps the spaces aren’t matching.
Is there a way I can accurately move from MNI152NLin2009cAsym to the space of the mni152 MRIcroGL template ?
Hi @foldes.andrei , to my understanding and from what I saw when looking both at mni152.nii.gz and tpl-MNI152NLin2009cAsym_res-01_desc-brain_T1w.nii.gz in FSLeyes, both images are representing the same brain with the same size!
In your case, it is possible that the misalignment is coming from one of your preprocessing steps, either the bold-to-T1w alignment or the subject T1w normalisation to the MNI152NL2009cAsym. Could you check that there was no misregistration there?
So shouldn’t these have similar affines if they’re representing the same brain? I checked and my group level stat maps are indeed in the same space as tpl-MNI152NLin2009cAsym_res-01_T1w.nii.gz
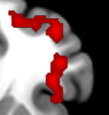
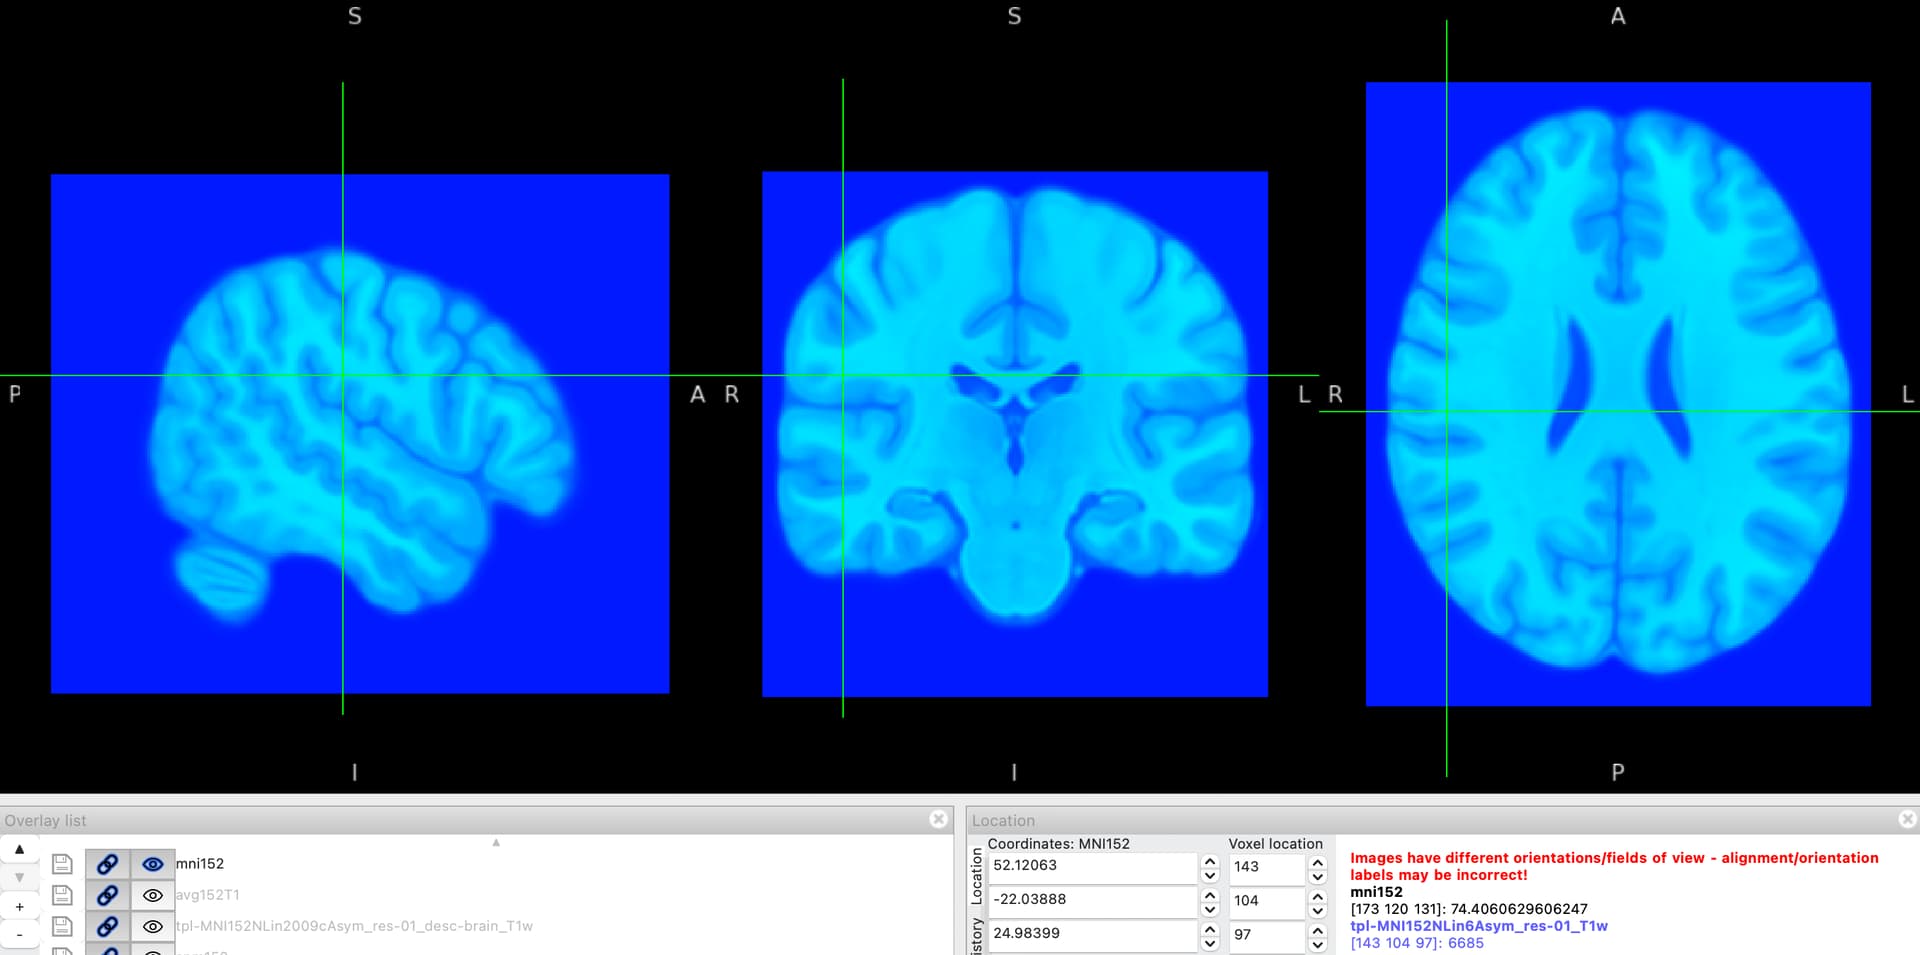
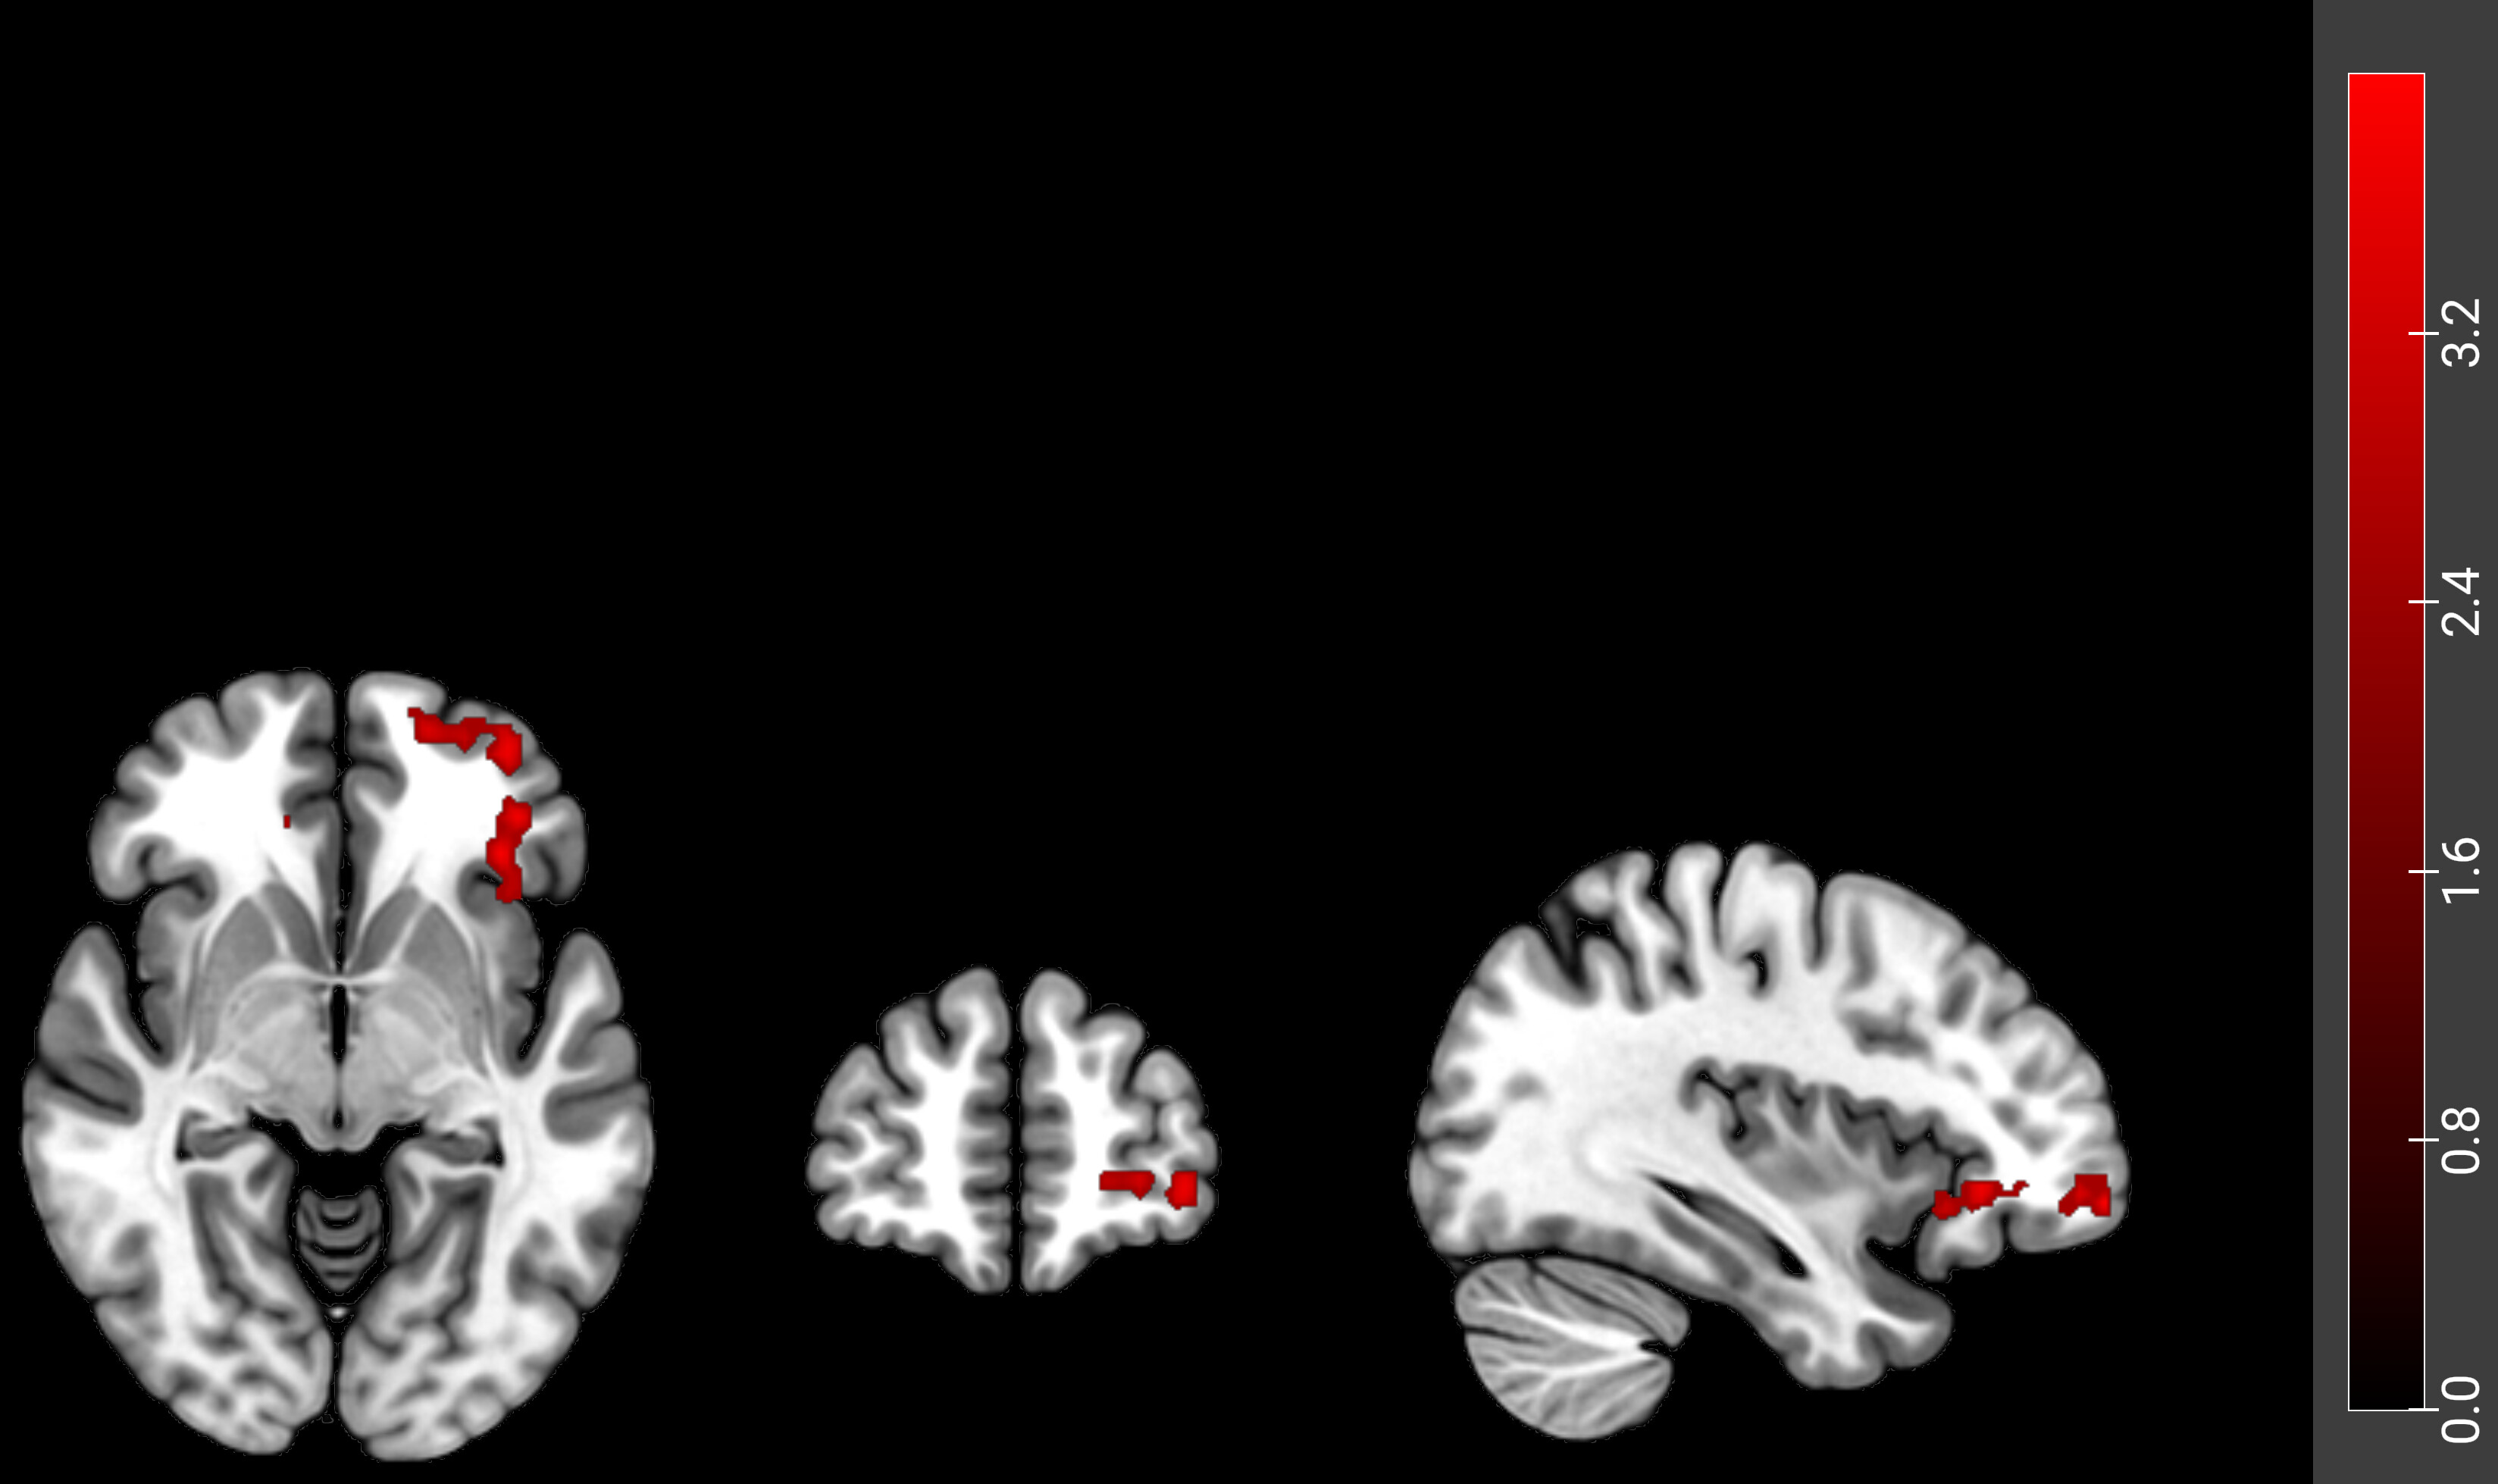
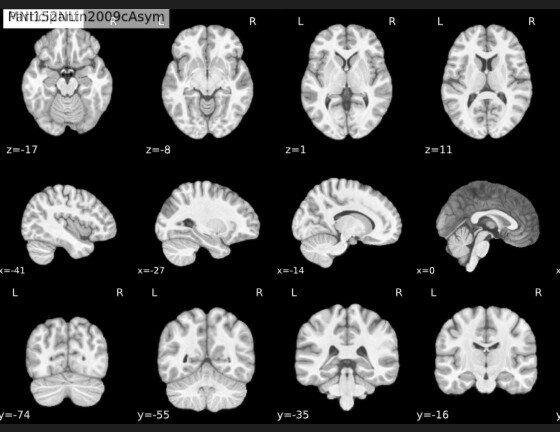
Good remark: in fact both two images: mni152 (blue in the figure below) and tpl-MNI152NLin2009cAsym_res-01_T1w.nii.gz (red in the figure below) represent the same object (the template brain from MNI152NL2009Asym) but sampled in different grids (different voxel spacing and different matrix sizes as reported by fslhd):
To have those two images showing the brains in the same position in the viewer but on different grids, you need to have different affines for those two images. If you want to have both images in the same grid, you would need to resample one image into the grid of the other one, and that would induce interpolation to decide which voxel values to put in each point of the new grid.
My point is that in general NIFTI viewers are good at displaying images in the correct position and you can see here that the brain image from the blue image overlap perfectly with the brain image from the red image.
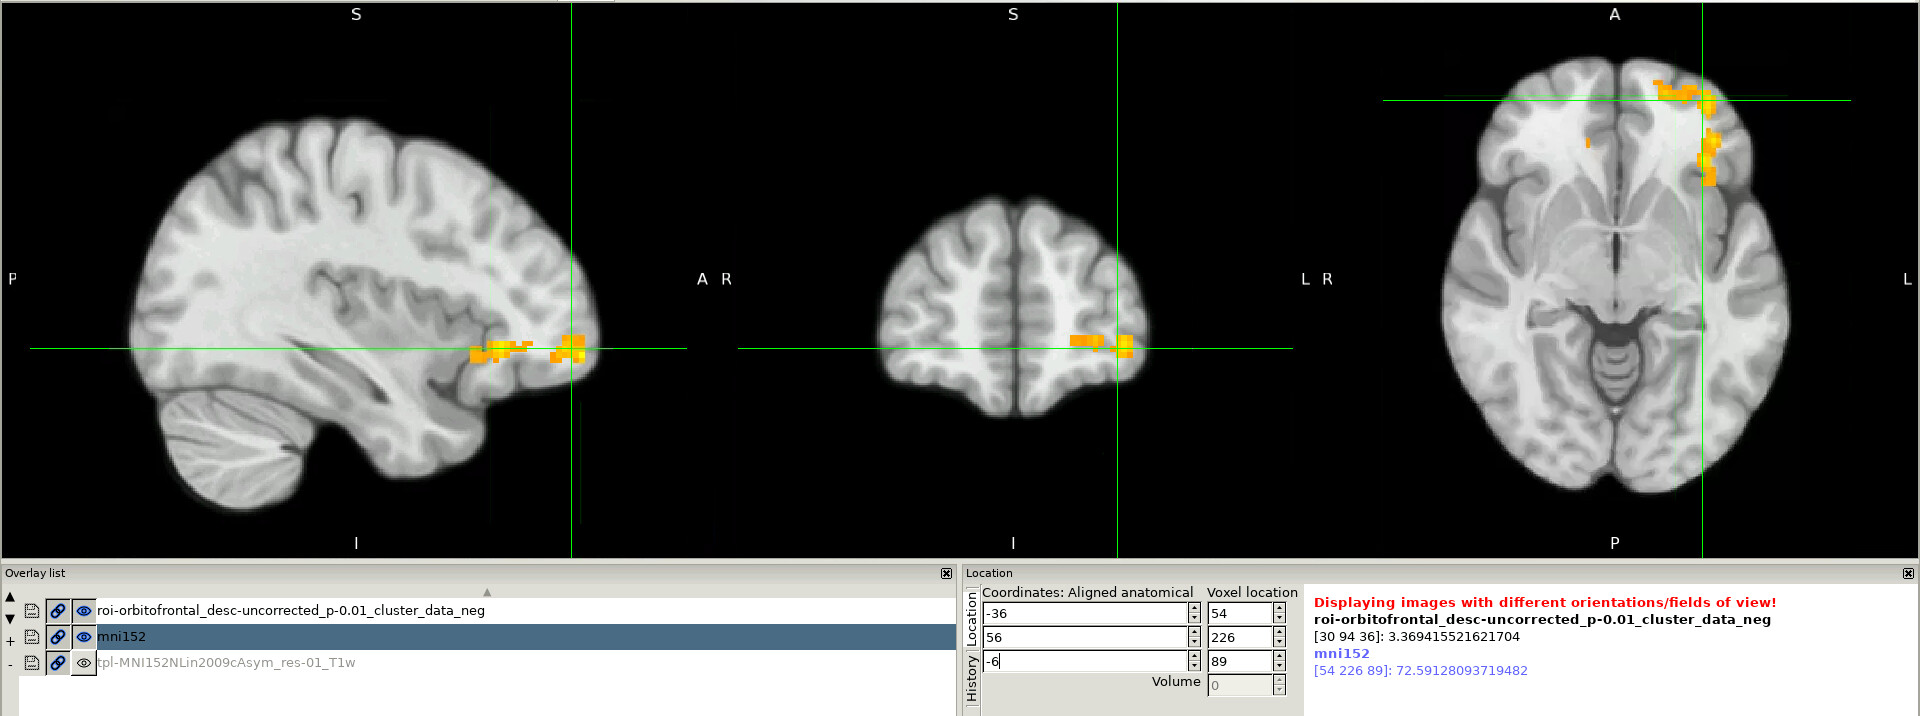
Going back to your initial question, you may want to try to overlay your activation and the underlying anatomy in another viewer to check if that is not a problem of display in MRICroGL , and if not, look back at the different stages of preprocessing to check if one step of realignment went wrong.
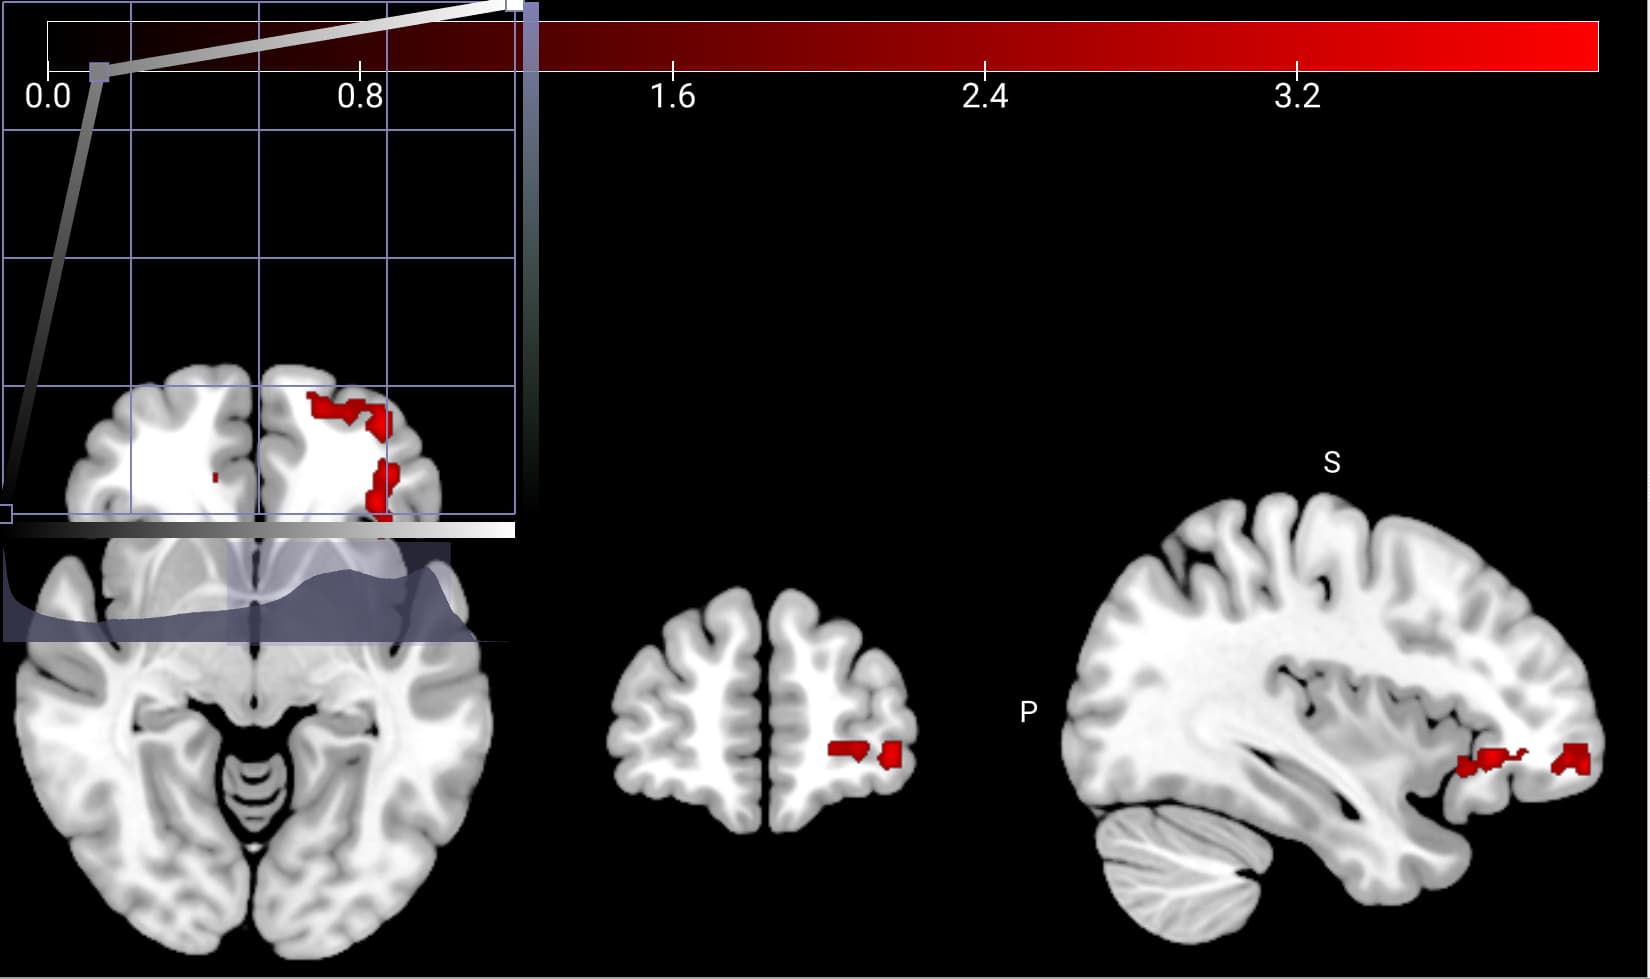
The plot thickens. Good idea using fsleyes - I even overlayed them in fsleyes and indeed they overlap, but look at my third figure; I’m using the exact same mni152 image borrowed from mricrongl. There it looks exactly better? Hm… do you think its due to how fast the viewer go from black to white?
To my eyes it looks like the image in nilearn doesn’t go through black at all, fsleyes looks darker, but not quite as dark as mricrongl? Does this prove that its something to do with colorbar?
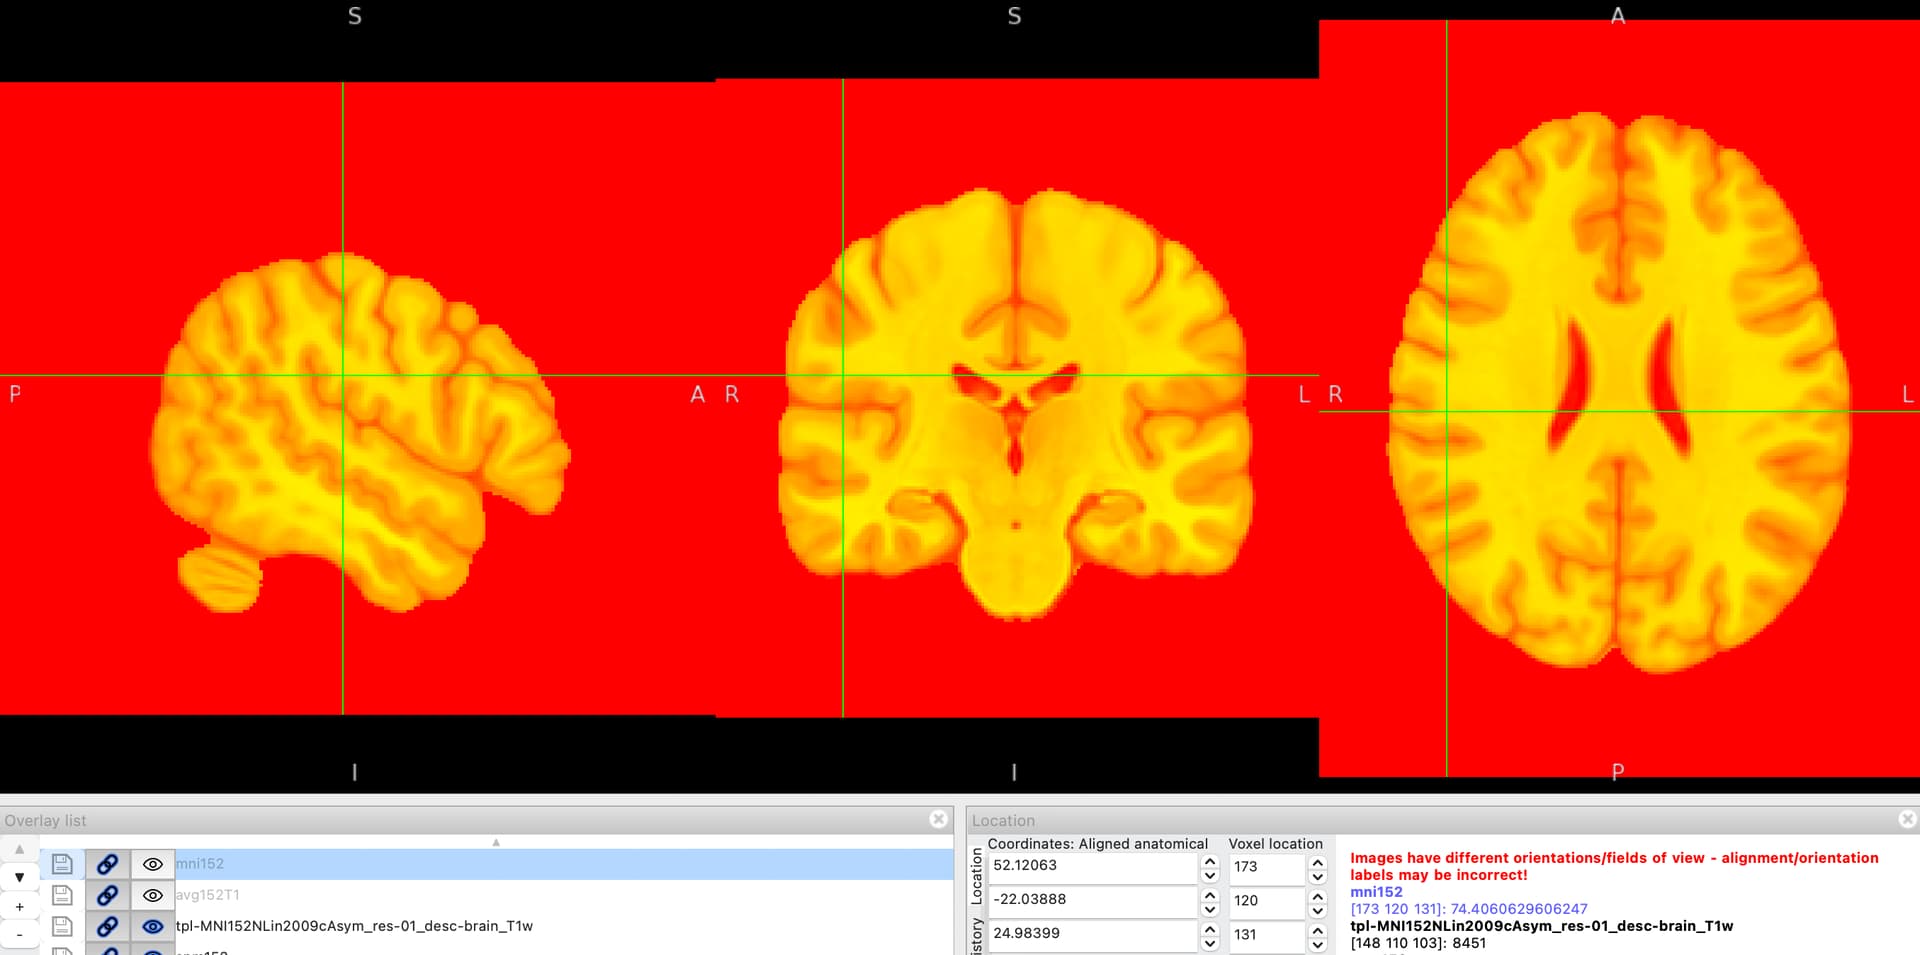
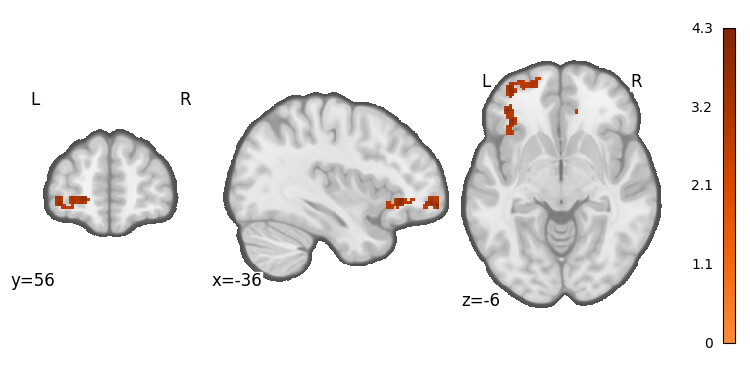
Data with nilearn
mni152_template = datasets.load_mni152_template()
# plot the cluster map without crosshairs
plotting.plot_stat_map(new_cluster_map_img, cmap='Oranges', bg_img=mni152_template, draw_cross=False, black_bg=False)
It looks like your statistical map is not well registered to MNI space. This could either be a problem with your normalization, or the fact that SPM was used for normalizing the data. As @jsein noted, SPM normalizes data to an average sized brain, while tools like FSL and ANTs normalize to the MNI brain which is larger than average (see Figure 1 of Horn et al..
As to the difference of contrast of the same T1 image with MRIcroGL and FSLeyes, this merely reflects the default window width (contrast) and window center (brightness) of your image. With MRIcroGL, you can adjust this with the darkest and brightest values in the Layers panel (shortcut: right-drag a mouse over the image). With FSLeyes, adjust the Brightness and Contrast sliders in the top tool bar.
The data was generated using an “fmriprep + AFNI” approach; when looking at the image in nilearn it looks ok, wouldn’t you agree?
In light of my previous post I was going to conclude that the issue arises from the different greyscale presets.
Here is the nilearn image again, but now using the MNI152 template used in mricrongl
@foldes.andrei , what could be useful would be to look at your preprocessed BOLD images overlayed on the template anatomical image to see how the realignment, normalization went. It will be more informative to see the whole functional brain and not only a few pixels from the activation.
Right, so these would be the *desc-bbregister_bold.svg (coupled with normalization plots) that are in the fmriprep quality reports under Alignment of functional and anatomical MRI data (surface driven)? The surface-driven registration passed for all subs; also passed my visual inspection.
Indeed those images look good, good alignment between bold and subject’s T1w, and good normalization of the T1w image. Those activations you showed above seem to be in the white matter! What is true is that the area you are looking at is particularly sensitive to deformation and dropout. It could be that the activations you are looking at are just coming from a deformation of your epi images in this area. What are you EPI acquisition parameters and what did you use to correct for susceptibility distorsion in fmriprep?
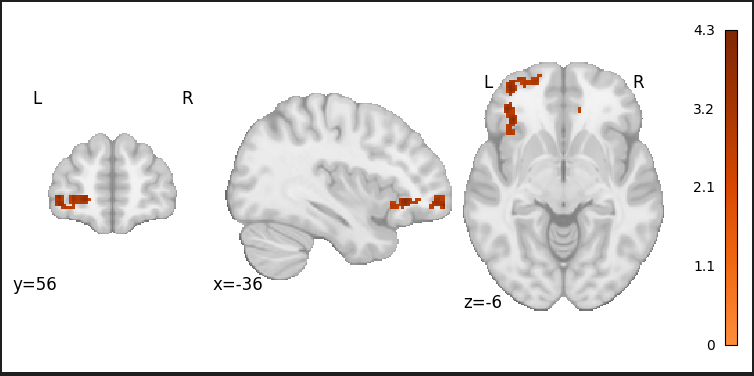
One other comment I have is that it looks like your statistical images have been thresholded. Our statistical maps are typically smoothed, and sub-threshold voxels neighbors to supra-threshold voxels will have intensities near the threshold. If you apply a statitical threshold to an image and zero all voxels below the threshold, you are artificially influencing the neighborhood of your image. The ideal solution to this is to only threshold images that are of the same resolution as your background image, to reduce interpolation artifacts. If this is not possible, you should consider using nearest neighbor thresholdling. For MRIcroGL, you can do this by choosing the Options pull-down of the Layers menu and make sure that Load Smooth Overlays is unchecked before loading an overlay.
The MRIcroGL menu item Scripting\templates\jagged shows you this effect and also shows how to switch on and off trilinear (blurry) and nearest neighbor (jagged) interpolation. If you look at the results from this script with the 2D slices view, you can see that the blue overlay (nearest neighbor) looks jagged, while the red overlay (trilinear) looks smooth.