Hi experts, this post is to generate discussion regarding censoring of fMRI timeseries.
To operationally define censoring, it is the identification of outlier volumes based on a metric (e.g., Framewise Displacement), and subsequently creating a design matrix of 1’s corresponding to the outlier volumes, and regressing them from the fMRI timeseries (e.g., using tools such as 3dTproject). Eventually, the residual timeseries, interpolated with zeroes in places where censoring took place, is used for connectivity analysis.
Recent studies (Ciric et al., 2017, Parkes et al., 2018) have shown that censoring is an effective method for amerliorating motion artifacts, but one big disadvantage of this method is the temporal degrees of freedom lost. But tDOF loss is relatively unexplored - what is the optimal tDOF for computation of connectomes?
A few relatively unexplored questions I have been thinking about:
How much data does one need for computation of connectomes after censoring? I see papers use the magical duration of ~4 minutes, but this number seems anecdotal at best and not empirically determined.
Does the residual timeseries need to have continuous uninterrupted data? What is the effect of having a big 4 minute chunk of data without any censoring done to it, versus small bits totaling to 4 minutes scattered around a long timeseries?
Does the length of original timeseries matter? How does having 4 minutes of data after censoring from an original 10 minute long scan differ from an original 20 minute long scan?
Are connectivity values in the connectome artificially inflated after censoring? Papers such as Ciric et al. 2017 have explored increase in modularity after various preprocessing steps (i.e. the separability into subnetworks, greater the modularity, greater identifiability of subnetworks). While identification of key subnetworks in resting state data is its canonical feature, I still doubt if modularity is THE metric to chase after. I illustrate an example below why connectomes may have artificially inflated values after censoring.
This particular high motion scan run consists of 300 volumes (2s TR, 10 minutes of data), minimally preprocessed using FMRIPREP. Following preprocessing, I ran 3dTproject with a high pass filter (0.01-inf), and in one condition, included nuisance regressors of 6 aCompCor and 6 motion parameters. In another condition, I identified outlier volumes at FD 0.5mm threshold, resulting in 233 censoring timepoints, 6 aCompCor and 6 motion parameters as nuisance regressors (along with high pass filter described above). The volume-to-volume FD trace is shown below:

Without censoring, I am left with 274 tDOF, and with censoring, I am left with 41 tDOF. Technically, 41 tDOF is too little amount of data to work with, but I go ahead and compute a 246x246 connectome anyways. Here is a historgram showing distribution of edges in the censored and non-censored connectomes:
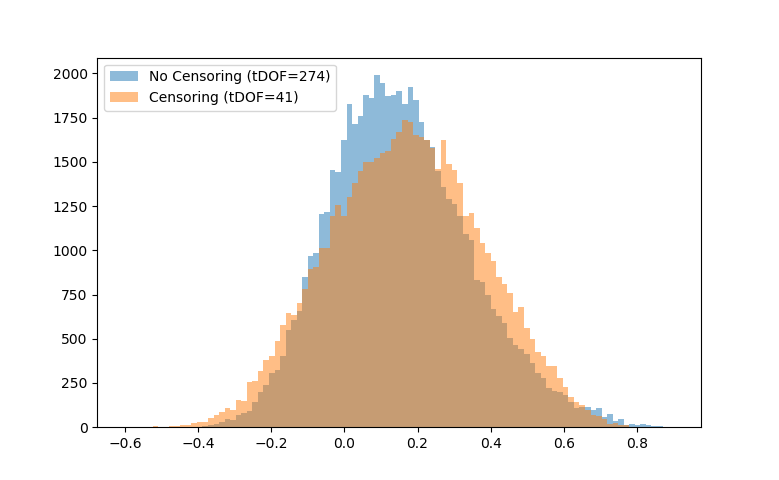
The distribution of connectivity values have become more variable with censoring (presence of more positive and more negative edges). Could this variability be due to the low number of timepoints present in the timeseries?
Using the Newman (2006) modularity algorithm, the value of Q increases from 0.2671 (in non-censored connectome) to 0.2795 (in censored connectome). This increase is consistent with what the Ciric et al. (2017) paper shows, however, is it possible that this increase in Q is due to the fact that number of positive and negative edges have been inflated due to low tDOF, leading to an increase in separability of subnetworks? Does the increase in Q have any meaning if I am left with too few tDOF to work with?
Just some thoughts I wanted to share and see if anyone has been thinking about these issues as well…