Nilearn: How to show montage of slices (similar to FSLeyes ''lightbox' feature)

Hi All,

I enjoy using Nilearn’s plotting features. However, if I am not misunderstood, nilearn appears to resample images before plotting.

My current data contains only 7 slices in the ‘z’ direction. I would like to plot each slice on an array using nilearn. However, I cannot figure out how to do so.

If anybody could help me or suggest alternative packages which could achieve this , that would be much appreciated.

Many thanks,
Joe

p.s. (I realise that I could achieve this manually using fsleyes but would like to script this)

p.p.s (I also realise that FSLeyes has a command line interface and hence could be scripted, however, I find it difficult to adjust the contrasts etc etc)

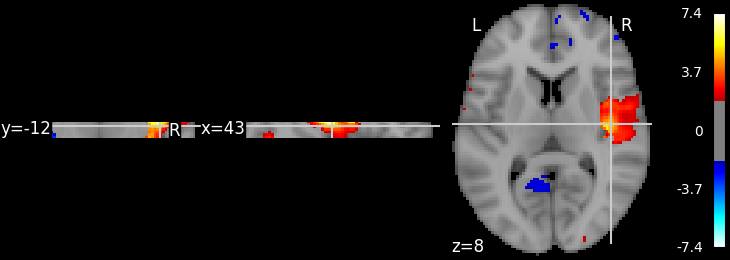
hello, thanks for your interest. your data has 7 slices but is it a brain image
with an affine? and do you want to plot it against an anatomical image as background?

  • if yes, you could resample the background image (e.g.
    nilearn.datasets.load_mni152_template() ) to your image using
    nilearn.image.resample_to_img, then pass the resampled background as bg_img
    kwarg to nilearn plotting functions. then no resampling will take place in the
    plotting functions because your image and the passed background will have the
    same affine and shape.

  • if no, why not simply use matplotlib.pyplot.imshow or something similar?

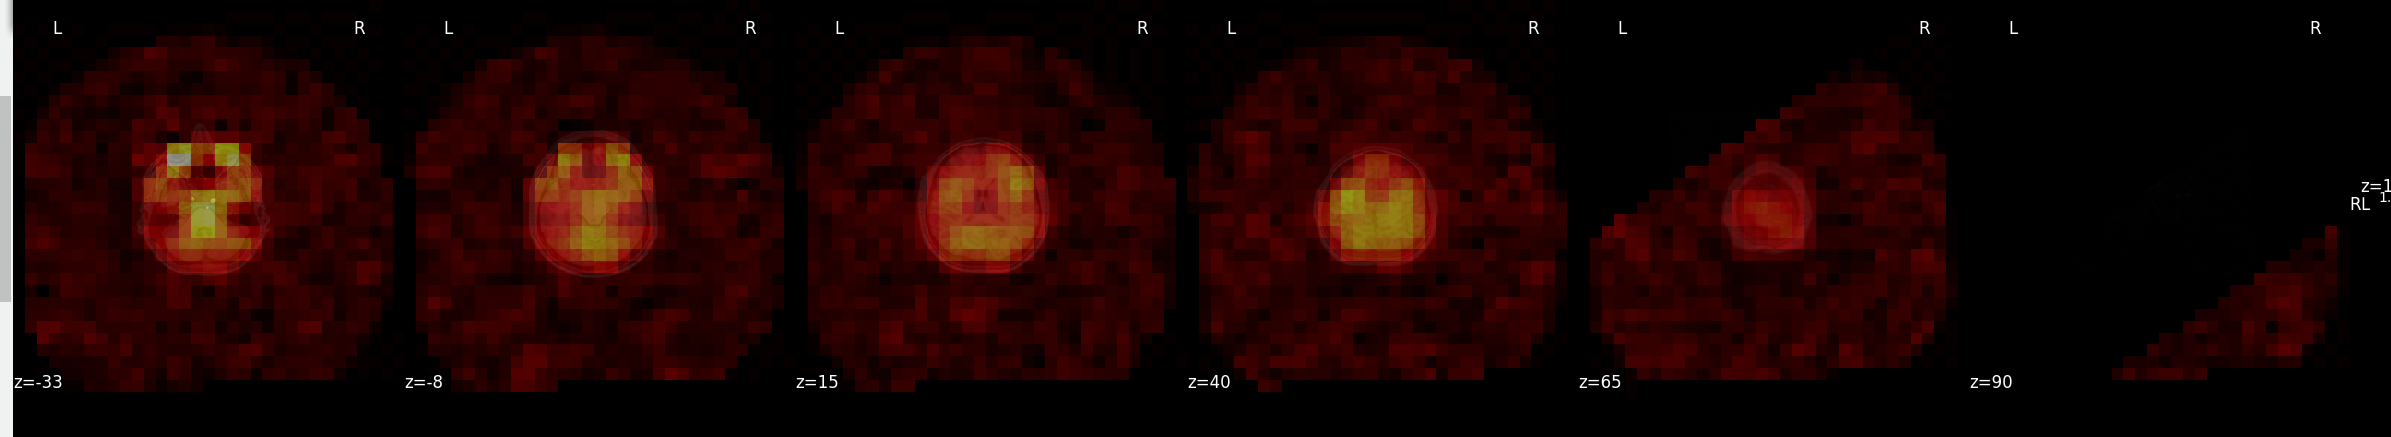
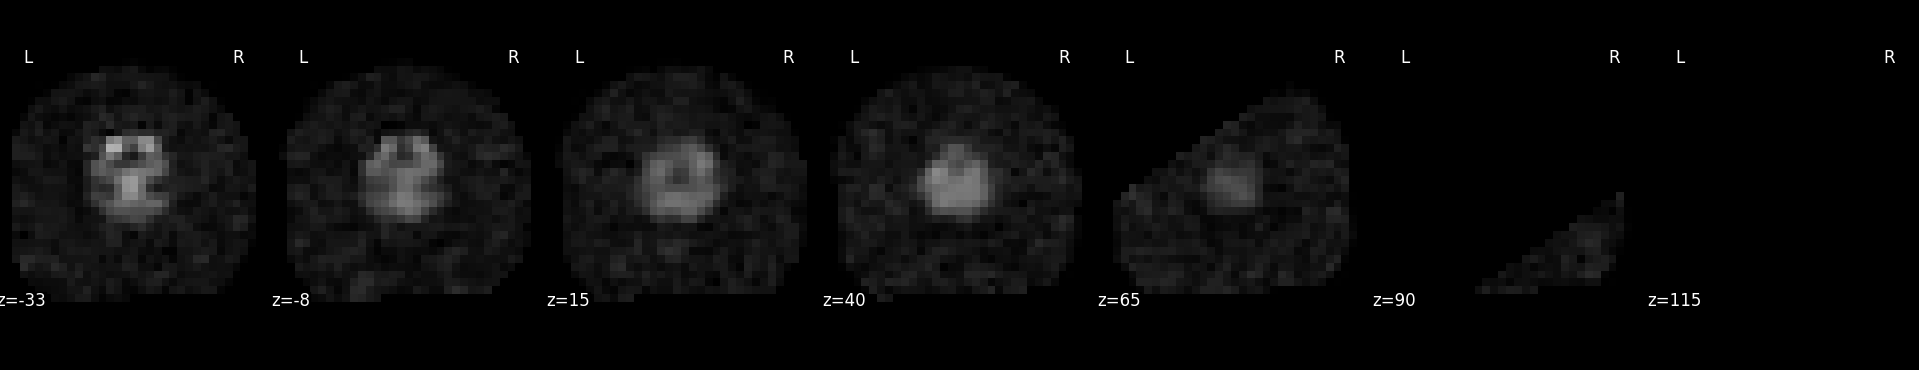
example plots of an image which has only 8 vertical slices:

Thank you very much for your reply. I think I am getting somewhere with this problem.

The issue is this:

I have a ‘low resolution image’ of the brain (32x32x7)

which I would like to overlay on :

An anatomical T1w image of the brain (240x240x146).

I would like to display all seven ‘z-direction’ slices.

In order to do so, I need to either upsample my low res image, or downsample my high res image.

The following piece of code almost gets me there:

plot_stat_map(low_res_image,  bg_img=t1w, display_mode='z', alpha=0.5)

However, owing to the differing orientation of image acquisition between low_res_image and T1w ,you can see that the final slices become ‘cut off’.

To simplify this further,

If i use the following simple plot function on my low resolution (32x32x7) image:

plot_anat(low_res_image,display_mode='z')

I still get images slices that are ‘cut off’ diagonally:

thanks! are you quite sure that these slices are complete in the image? could you share the image with us?

Hi Both,

Yes all 7-slices are intact.

I have uploaded the T1w and ‘low_res’ (32x32x7) images to the following shared folder:

https://drive.google.com/open?id=1B5uEwb4dz0GZ96y7WsJaq63zvk5y3a1x

If you could replicate this & figure out how I can present this data using nilearn that would be hugely appreciated!

Thanks again,
Joe

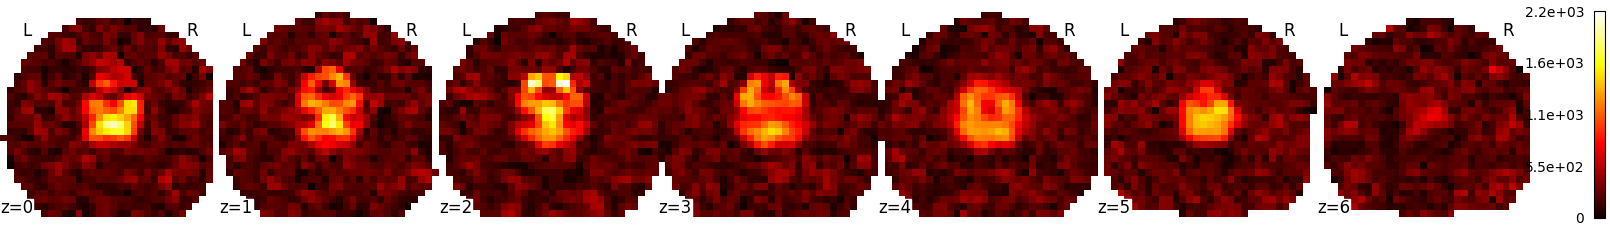
Hi, the affine of the image is not diagonal. I think in order to plot it nilearn rotates it so that the dimensions of the image are aligned with x, y, z axes. apparently when you cut your image in this directions the top slices have the shape you show , which seem to be cut. if you fool nilearn into ignoring the affine the slices don’t seem cut anymore:

but I can’t seem to register it to the anat image you provided. also, the stat map seems much bigger than the anatomical image:

>>> img.shape                                                                                                                                     
(32, 32, 7)
>>> np.linalg.eigvals(img.affine)                                                                                                                 
array([-15.00613871,  15.25692761,  24.56908872,   1.        ])
>>> anat.shape                                                                                                                                    
(240, 240, 146)
>>> np.linalg.eigvals(anat.affine)                                                                                                                
array([-1.0001488 ,  1.08612017,  1.10468951,  1.        ])
>>>  

I think this may be what I need. Could you please explain/ post the code that you used to do this?

The field of view for the stat map is indeed much larger. It was acquired immediately following the T1w image in the same space, and so setting the T1w image as the bg_image should work via resampling, no?

you can do this:

>>> import numpy as np                                                                                                                            
>>> from nilearn import image, plotting                                                                                                           
>>> import nibabel                                                                                                                                
>>> img = image.load_img('low_res.nii.gz')                                                                                                        
>>> img = nibabel.Nifti2Image(img.get_data(), np.eye(4))                                                                                          
>>> plotting.plot_stat_map(img, display_mode='z', cut_coords=10, bg_img=None, threshold=0)

but it is a hack and you lose the affine; it gives you the same thing as you would get by plotting each slice eg with pyplot.imshow. the image looks weird when I resample it to the anatomical image.

I decided to go for a more manual solution:

  1. Upsample the low res --> T1w resolution (using nearest neighbour interpolation)
  2. Cycle through each ‘z-slice’ on the upsampled image
  3. Save the z-coordinates of ‘unique’ slices
  4. Plot unique slices using the nilearn cut_coords option

I think this should achieve what I need. Thank you for all of your help.

Joe

glad to hear you found a solution!