Hello everyone, I am starting to work with nilearn and hit some bumps, while using the COBRE dataset and trying to apply ICA on the dataset so I can use it later for a classification problem, when I plot the output all the images are filled with black pixels and I have no idea what it means, is there anybody able to help?
nilearn library on python
import os
from nilearn import image, plotting
from nilearn.decomposition import CanICA
# Path to the main COBRE directory

main_dir = r'\COBRE_scan_data\COBRE'
print(os.listdir(main_dir))
# Create a directory for averaged data if it doesn't exist


# Create a directory for plotted averages if it doesn't exist
ica_dir = os.path.join(main_dir, 'ica_results')
os.makedirs(ica_dir, exist_ok=True)

# Loop through each patient directory
for patient_dir in os.listdir(main_dir):
    patient_path = os.path.join(main_dir, patient_dir)
    if not os.path.isdir(patient_path):
        continue

    # Find the rest directory for each patient
    rest_dir = os.path.join(patient_path, 'session_1')
    rest_dir = os.path.join(rest_dir, 'rest_1')
    if not os.path.isdir(rest_dir):
        continue
    canica = CanICA(
    n_components=20,
    memory="nilearn_cache",
    memory_level=2,
    verbose=10,
    mask_strategy="whole-brain-template",
    random_state=0,
    standardize="zscore_sample",
    n_jobs=2,
    )
    # Load the rest.nii.gz file and calculate the mean image
    rest_img = image.load_img(os.path.join(rest_dir, 'rest.nii.gz'))
    canica.fit(rest_img)


    # Save the mean image to the averaged data directory
    output_path = os.path.join(ica_dir, f'{patient_dir}_ica_components.nii.gz')
    ica_components_img = canica.components_img_
    ica_components_img.to_filename(output_path)


# Plot all ICA components together
from nilearn.image import iter_img
from nilearn.plotting import plot_stat_map, show

for i, cur_img in enumerate(iter_img(r'0040092_ica_components.nii.gz')):
    plot_stat_map(
        cur_img,
        display_mode="z",
        title=f"IC {int(i)}",
        cut_coords=1,
        colorbar=True,
Screenshots / relevant information:
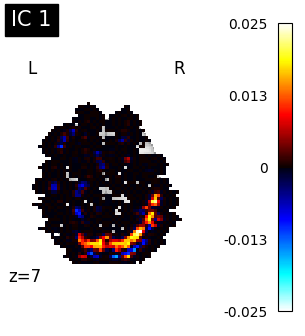
evidently this is very different than the example found on the website
any help is very much appreciated