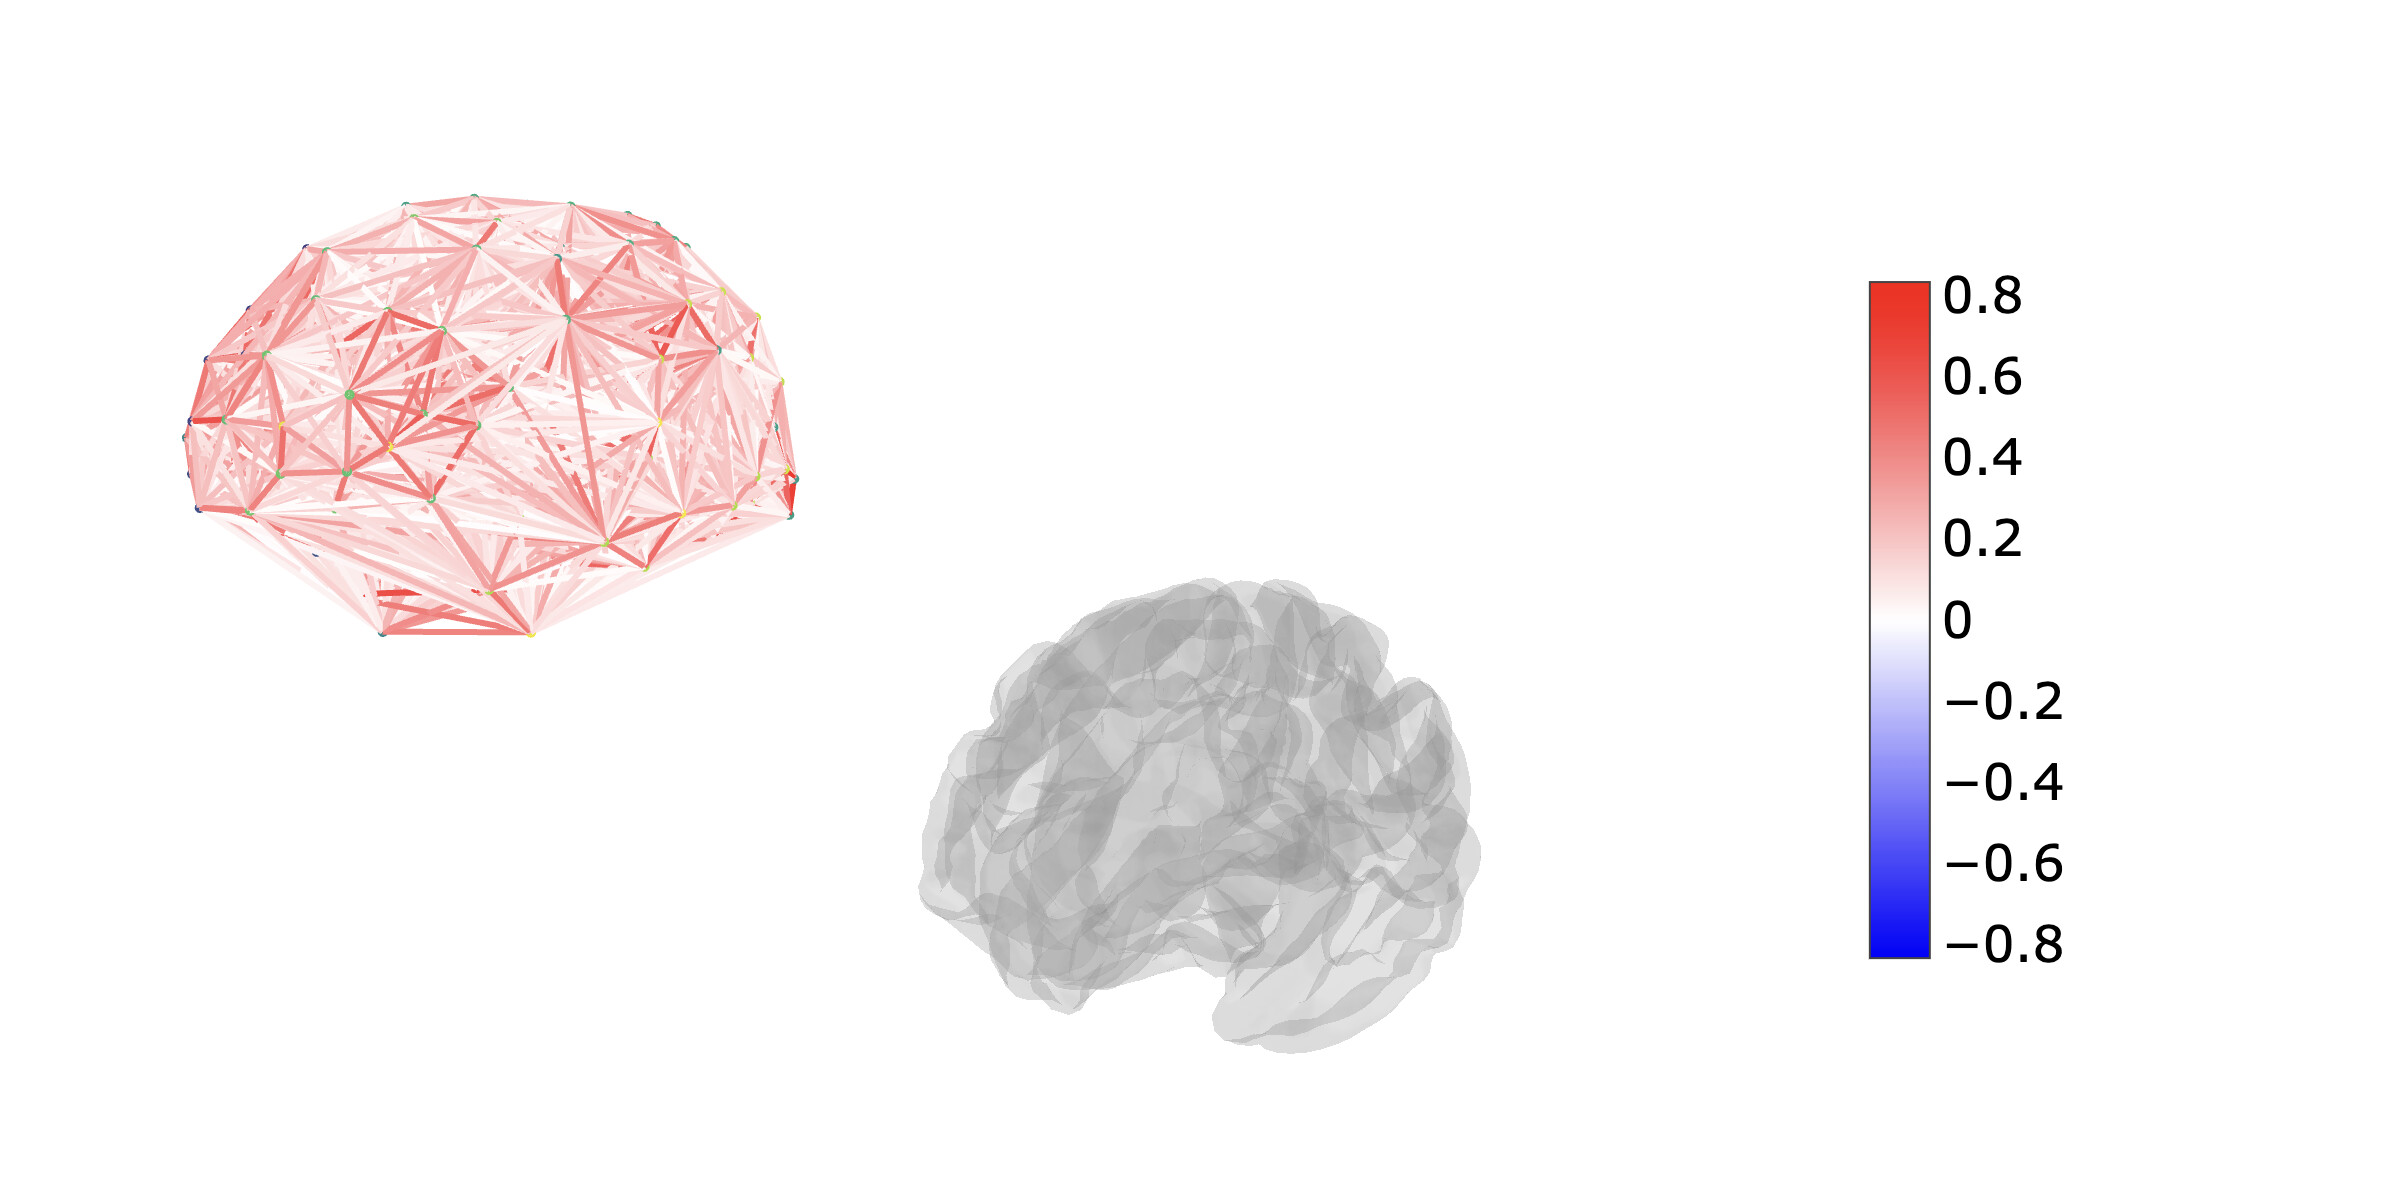
Hi everyone! I am trying to plot a graph derived from averaged fmri correlation matrices, by using the code
{
from nilearn import plotting
values = listnet(nx.closeness_centrality, G, distance=‘distance’)
plot = plotting.view_connectome(matrix, node_coords=node_coordinates)
node_sizes = np.array(values) * 100 # Adjust the scaling factor as per your preference
node_colors = values
plot.node_size = node_sizes # Set node size
plot.node_color = node_colors # Set node color
plot.open_in_browser() }; when I get the actual plot the graph with its nodes and edges doesn’t overlap with the brain surface, as you can see from the image.
Anyone knows how to correct this?
Thank you so much!