Hello! I am new here. This looks like a nice forum.
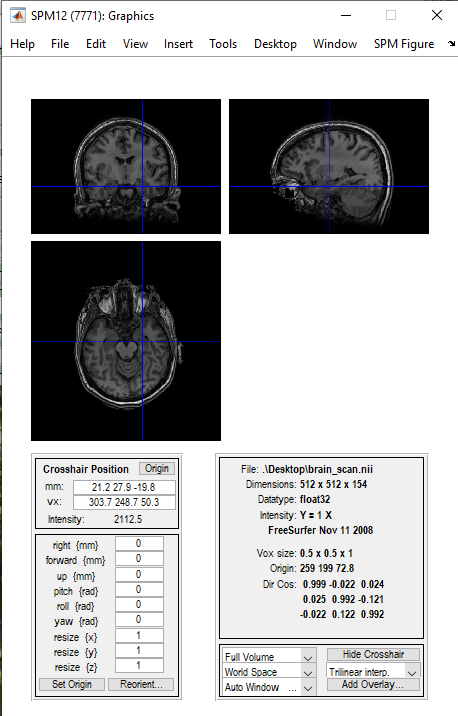
I am trying to plot a brain scan from OpenNeuro.org, which I first visualized with an open-source software to see how it looked:
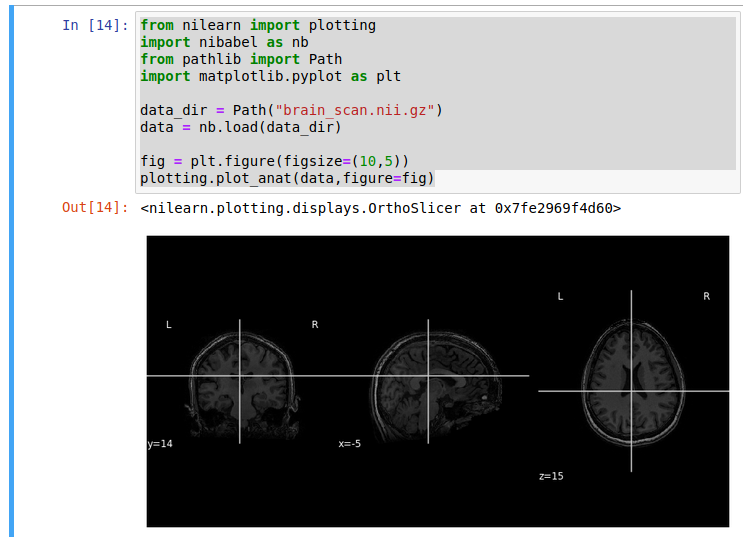
And I am allowed to interact with it, that is, move in the x, y and z-axis. The problem is that I am not allowed to that using NiLearn on Jupyter Notebook. The code I wrote is the following:
from nilearn import plotting
import nibabel as nb
from pathlib import Path
import matplotlib.pyplot as plt

data_dir = Path("brain_scan.nii.gz")
data = nb.load(data_dir)

fig = plt.figure(figsize=(10,5))
plotting.plot_anat(data,figure=fig)
But by doing this, I am only getting a static image and I am not able to see the brain from inside.
I also tried to add the ‘%matplotlib notebook’ command but I only get some commands below and still no interaction. Plus, the image is unscaled.
Any idea? Thanks in advance.
Hi @blancoarnau,
Welcome to NeuroStars ! 
I’d recommend checking out the view_img function. You can try it in the docs to confirm it’d be useful for your needs.
If you’d like to plot an anatomical image with view_img, it could look something like:
import nibabel as nb
from pathlib import Path
from nilearn import plotting

data_dir = Path("brain_scan.nii.gz")
data = nb.load(data_dir)
plotting.view_img(data, bg_img=False, cmap='Greys')
Note, too, that nibabel comes with it’s own orthoview function. In which case, the code would look more like:
import nibabel as nb
from pathlib import Path

data_dir = Path("brain_scan.nii.gz")
data = nb.load(data_dir)
data.orthoview()
Hope that helps. One meta-note: you should be able to add tags on your posts (like nibabel or nilearn) which will make sure the developers are pinged directly ! I know I appreciate the pings 
1 Like
Thank you so much for the quick response!
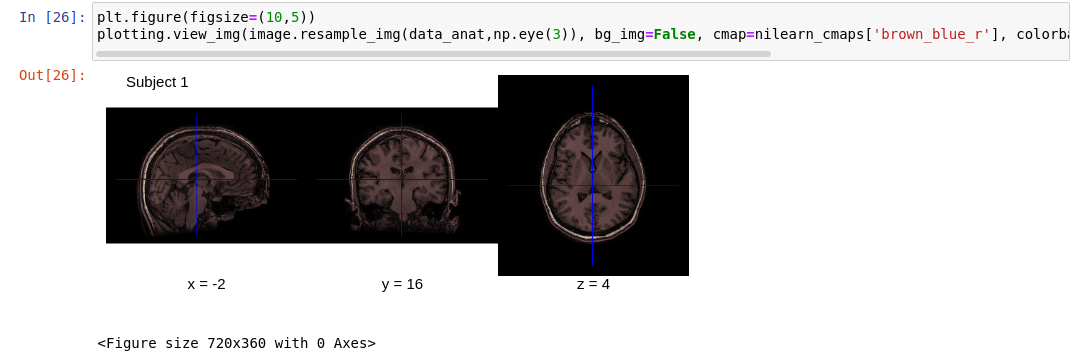
Also, is there any way I can make the plot bigger? I tried ‘plt.figure(figsize=(10,5))’ but it’s not working for me… Thanks a lot!
Try this :
fig = plt.figure(figsize=(10,5))
plotting.view_img(data, bg_img=False, cmap=‘Greys’, figure = fig)
1 Like