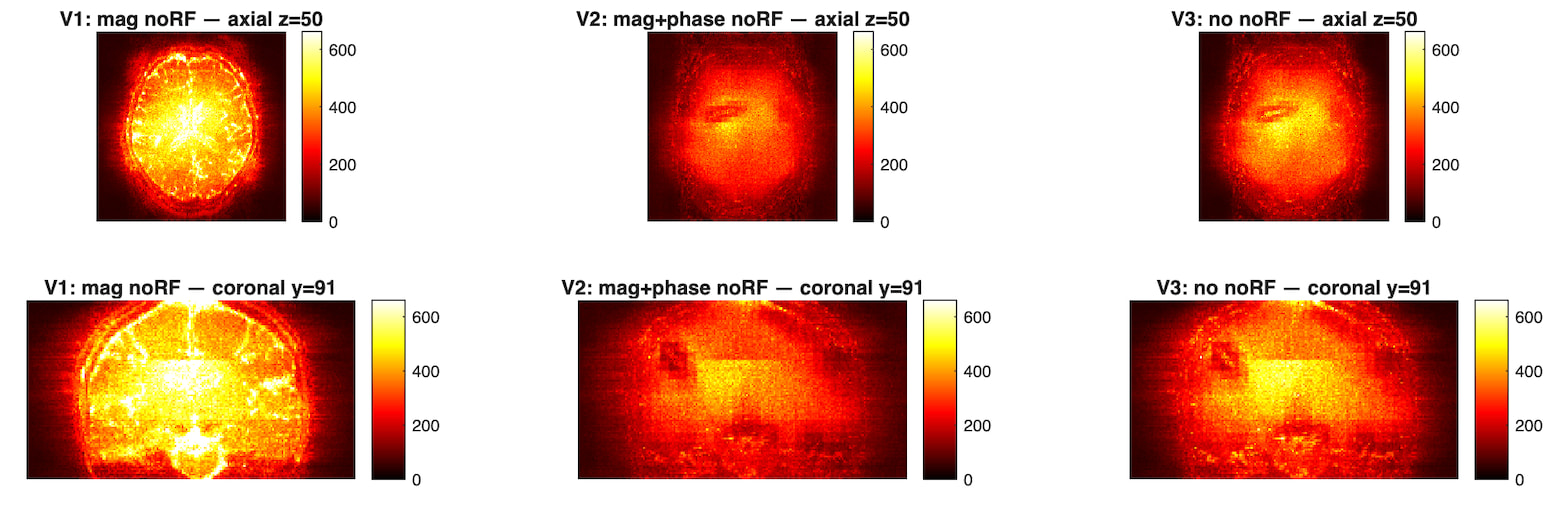
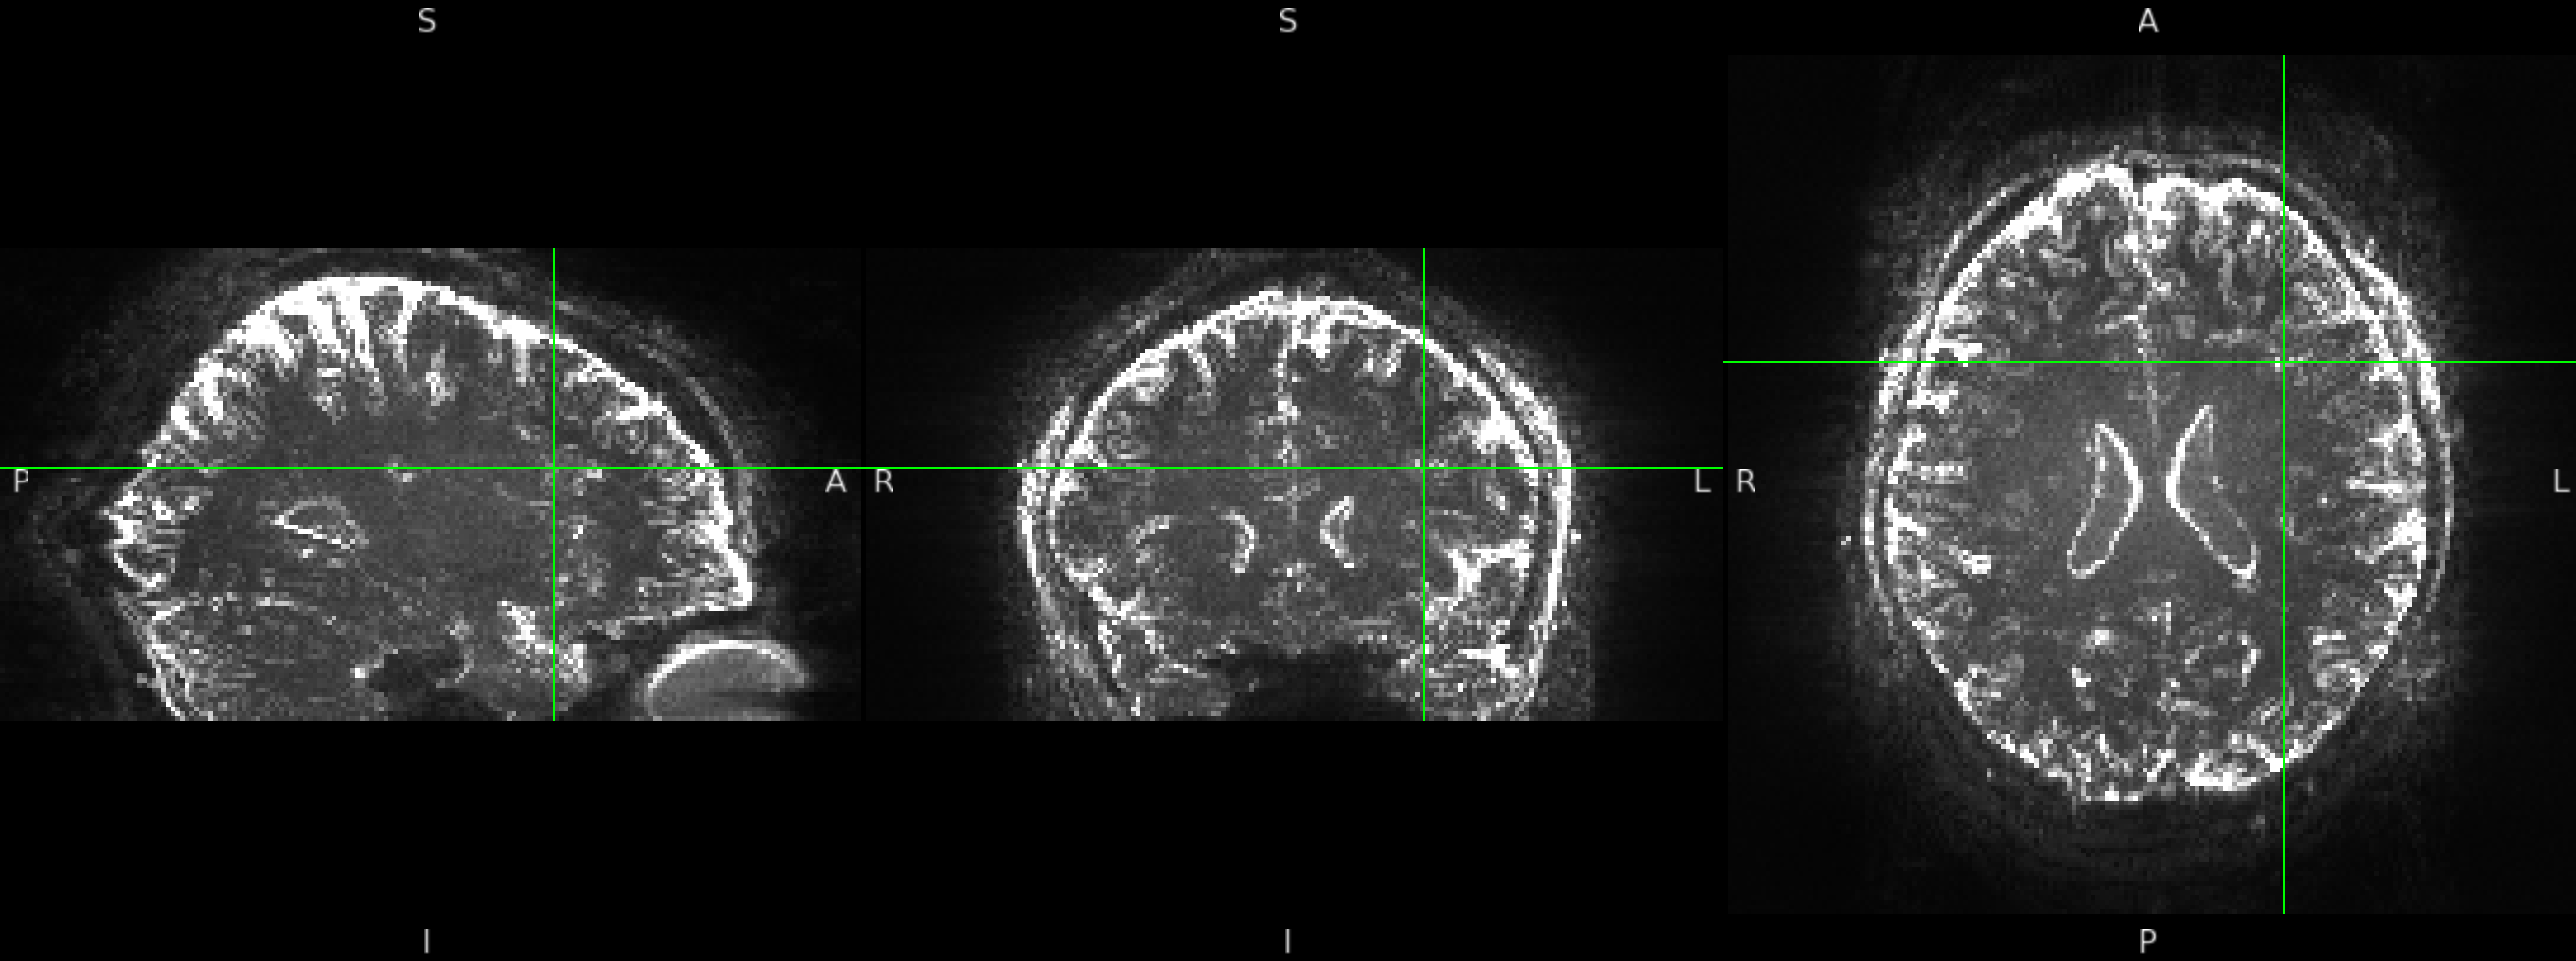
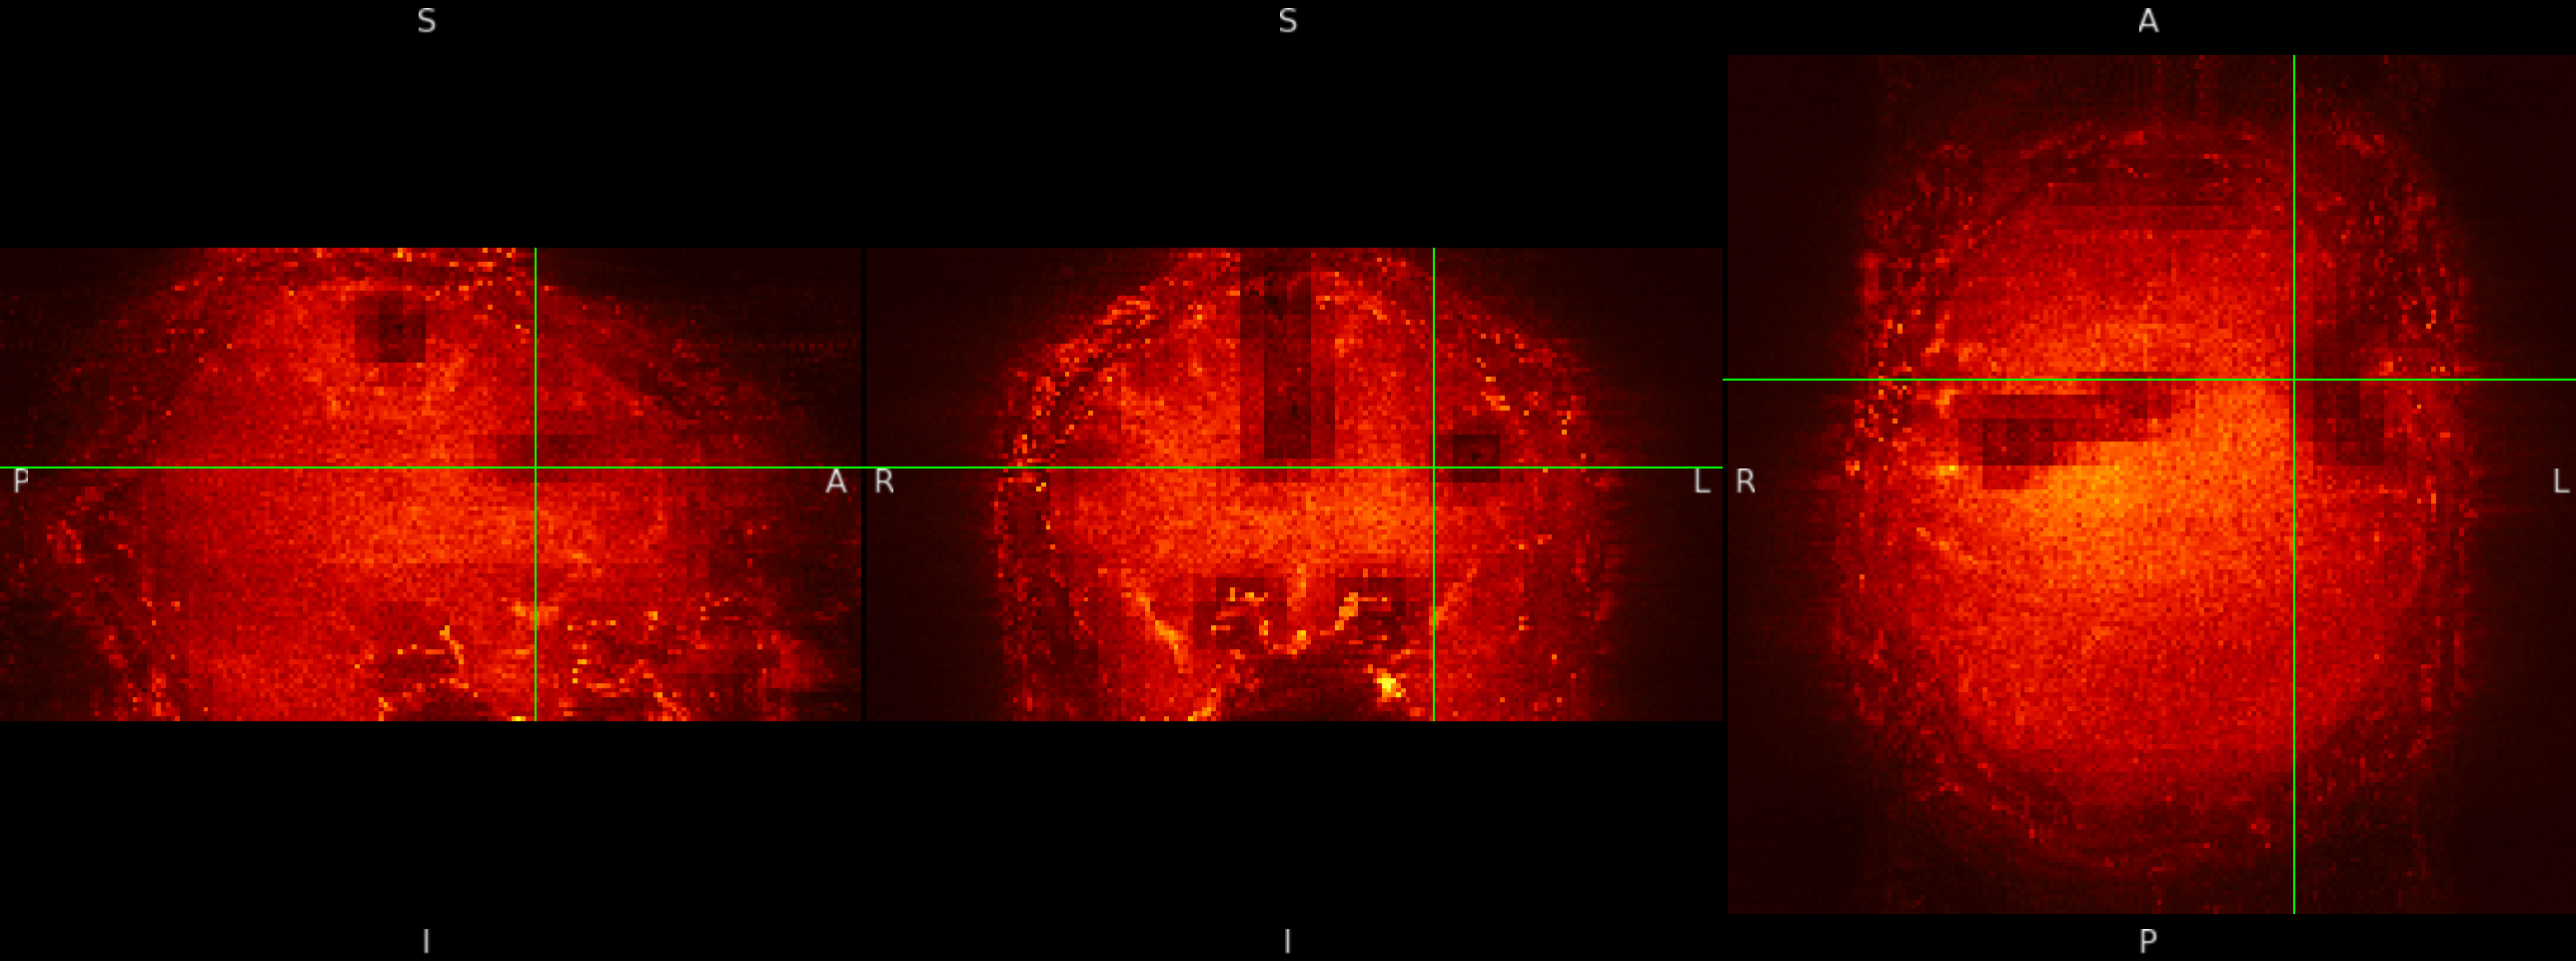
I am analyzing NORDIC-denoised data and have noticed patch-like structures in the standard deviation of the residuals (see examples below). These patches appear both when using noRF volumes (V2) and when not using them (V3).
For comparison, I also looked at the standard deviation from the NORDIC-denoised data using magnitude-only input (V1). From these SD plots, the patches seem to appear only when phase information is included.
Has anyone else observed similar patterns in their data? If so, how did you address or interpret them?
Hi.
These images are from a custom SMS sequence with 1.2mm isotropic voxels, TE=23ms, GRAPPA 3, MB 3, PF 7/8 on a Siemens MAGNETOM Terra 7T scanner. However, we also see similar effects in the sequence used in Miletic et al.,2020
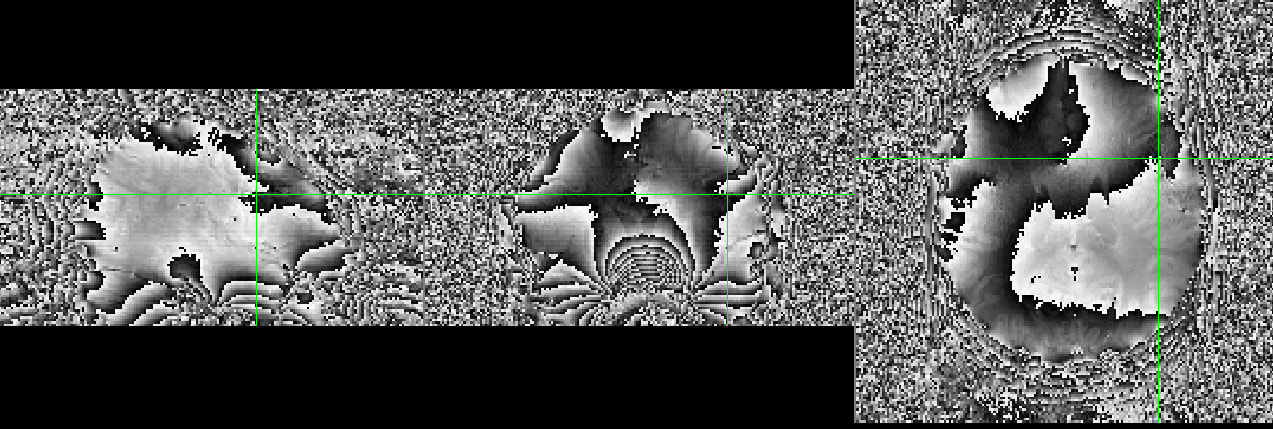
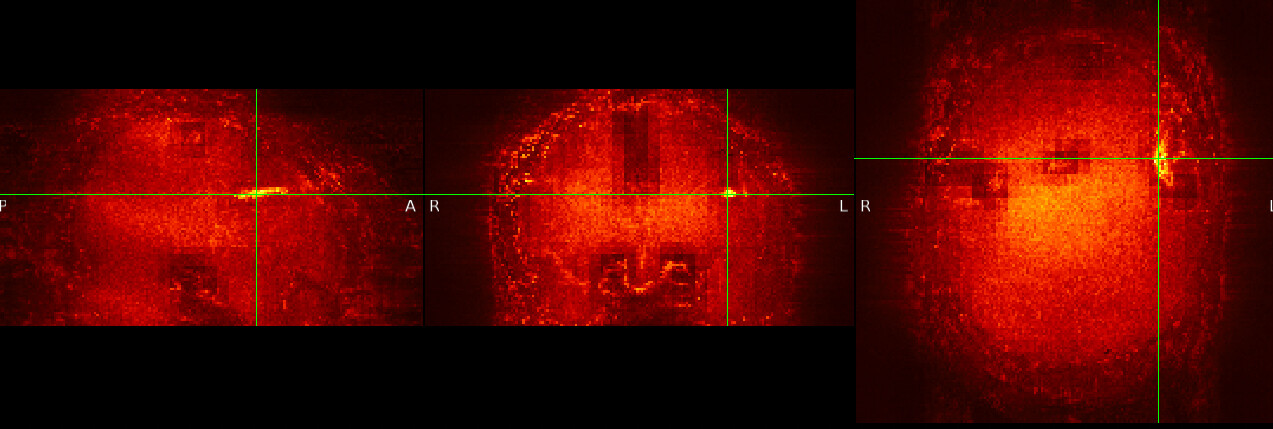
I left the cross at the same point for all the images and I intentionally placed it in one artifact area. This one looks more like a crayon draw than a rectangle, although some rectangles are noticeable too.
We’re running NORDIC with the defaults for fMRI. The artifacts appear when we’re using noRF volumes too.
Very odd! The first (V1 mag noRF) image looks “normal” for temporal standard deviation for a highly accelerated sequence; the three bands (middle of the brain in the brightest axial stripe) match the MB3 sequence. FWIW, I usually try to reduce the acceleration (maybe less GRAPPA?) when the band artifacts are so prominent.
I’m not especially familiar with the NORDIC, but the patches showing up after that denoising was applied certainly suggests it’s to blame; I assume the dicoms/unprocessing niftis look ok (without the patches)? The patches are located sort of near large vessels; does the algorithm do something extra in those areas? Another debugging idea is to compare patches in different individuals - do their locations vary more with sequence or person?
Hmmm, good question about the algorithm - vessels set. AFAIK it does not do anything different. I ran it again with other settings (increasing the kernel_size_gfactor ) and this seems to improve the high intensity spot, but it also increases the rectangles contrast:
We have always observed banding in std maps when combining in-slice and multiband acceleration. Do you have a std map or the original magnitude data?
Would it be possible that eye motions (and the fact the eyes will move in/out of the FoV in the shown angulation) mixed with multiband unaliasing to cause this? I mean that if the multiband reference scan contains the eye at one position but the accelerated one crop it differently, the unaliasing might not perform well.
Apologies for the confusion. The sequence is CMRR’s. The banding artifacts are due to the MB, those are expected.
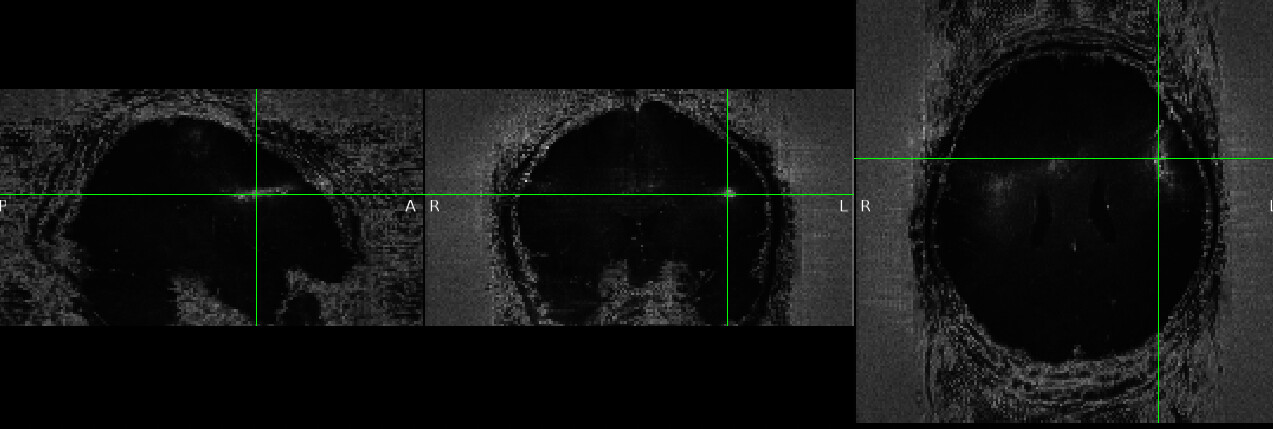
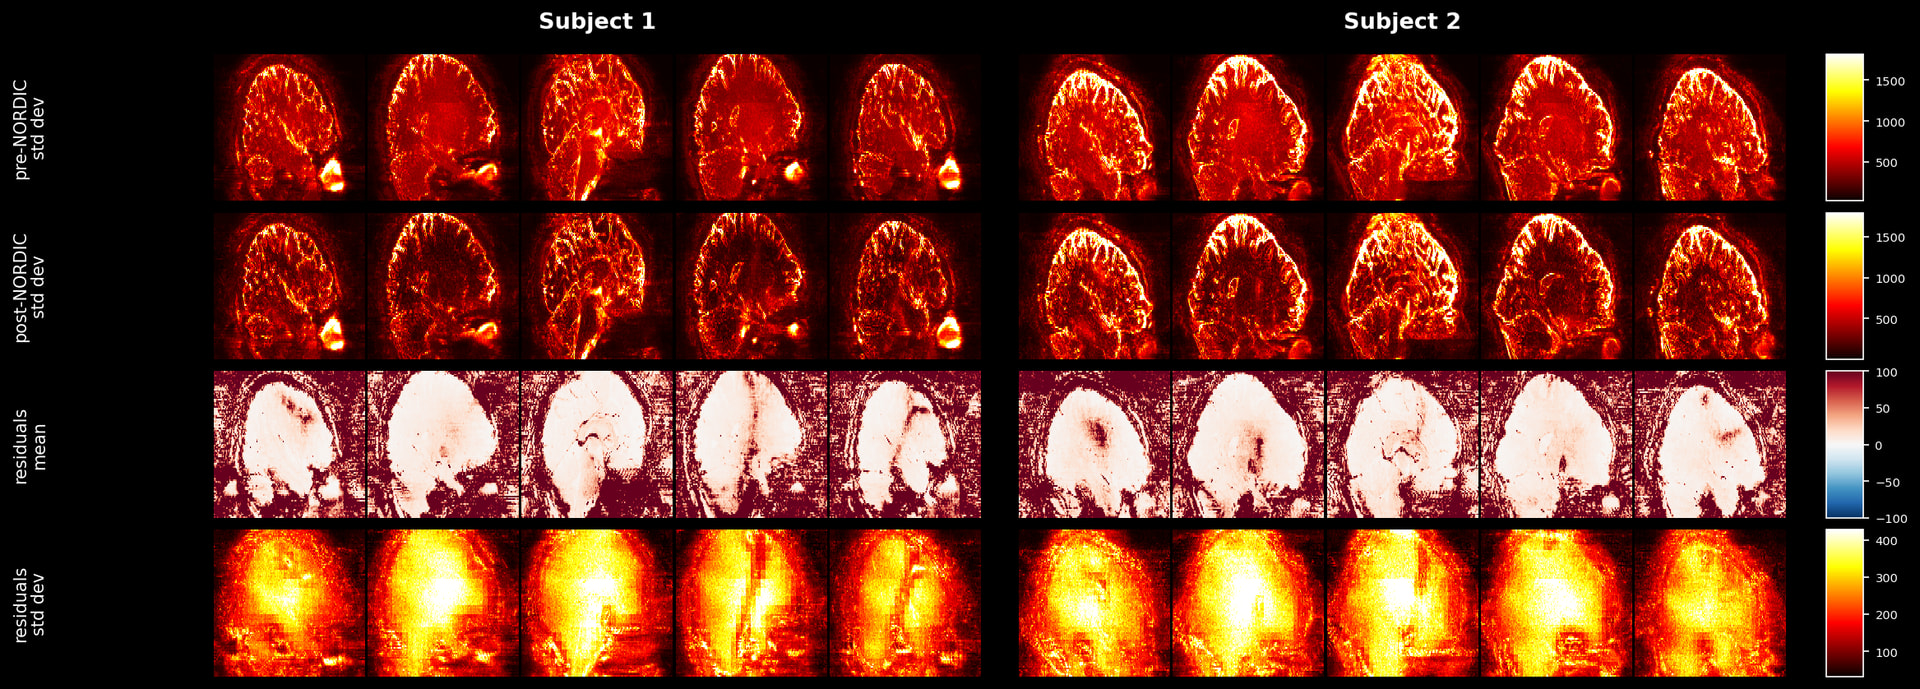
I tried a second subject and the results are similar. Artifacts tend to land in frontal superior areas but vary in size and exact location between subjects (anatomy related?). I have included the SD from the raw images (preNORDIC) and the images once processed with NORDIC (postNORDIC).
Let’s take subject 1 as an example. In the mean of residuals (preNORDIC - postNORDIC), I can spot a weird high intensity line crossing the whole brain. I can notice that line in the standard deviation of the postNORDIC image and I cannot in the original data, so it seems NORDIC-related, not sequence related.
I think @jaetzel hunch is right, the patches are showing up because NORDIC performs the denoising in patches. I wonder if the components removed from those patches are too different that it creates these artifacts and if true, why? The mean of residuals also point to non-zero elements around those areas, which is odd since I understand NORDIC is supposed to remove Gaussian noise (centered around 0). Happy to be corrected thou!
I also tried different kernel sizes, different patch sizes and nothing seems to be working too different from the images I showed.
I have a couple of questions:
Has anybody seen these artifacts in their data (residuals between NORDIC preprocessed and raw data)? Basically, all I am doing is substracting preNORDIC - postNORDIC and then computing its mean and standard deviation over time
How would be the best strategy to test if it is vessel-related?