Hi,
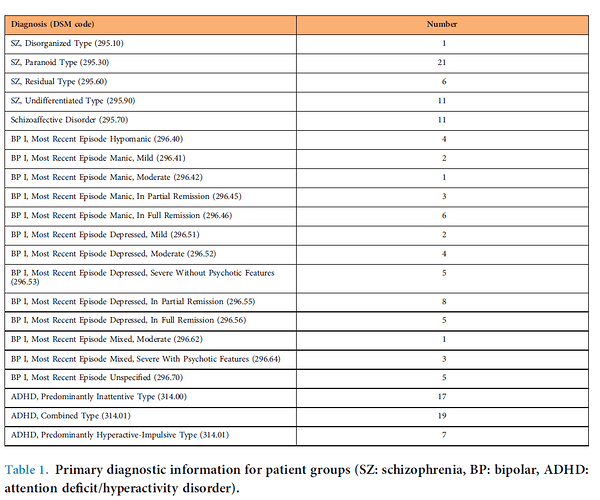
I want to use Bipolar Disorder subjects in my thesis and I do not want to add sub-participants which are mentioned in the article that you summarized diagnosis of subjects. How can I reach the list which shows the sub-diagnosis of participants ? There is a bipolar.tsv and json file at phenotype directory but before I try to classify them according to their answers, I want to ask is there any subject list of table 1 in the article below.
https://www.nature.com/articles/sdata2016110.pdf
Thanks
Abdullah
Hi @Abdullah_BAS
Thank you for your question. If I may clarify - you are looking for subjects that were not included in the original paper? The paper linked is the data descriptor paper describing the data. Perhaps are you looking for the diagnosis per subject? If I may also point to the OpenNeuro dataset (the next iteration of OpenfMRI) of the CNP. In the participants.tsv provides the diagnosis status for each subject.
Thank you
Hi @franklin
Thanks for your help but I know there is a tsv file which includes diagnosis information. I have already separated disorder groups and healthy participants. Here is my core question
I need to seperate Bipolar disorder into sub-groups - Bipolar manic moderate,manic mild, depressive,mixed etc- as the authors did in their paper which I posted its link above. For clarify I need
to reach “BP1,Most Recent Episode Mixed,Moderate (296,62)” participants list and the all other’s.
Thanks
Abdullah
Hi @Abdullah_BAS
Thank you for your message. It appears to help breakdown into particular subgroups the phenotypic folder contains several tsvs that should emerge these subgroups. The associated json provides what the tsv columns are defined as.
Thank you,
Franklin
1 Like
Hi @franklin
I couldn’t find any direct tsv file which consists of these subgroups. I saw just one tsv with the name of bipolar. I tried to understand tsvs and json files but I havent find any list of any subgroups yet. Did they produce the table in the paper from these tsvs. Is it indirect table ? Have I to create this table from raw information tsvs with the clinical diagnosis procedure ? Sorry but I am stucked here I have to solve this to continue my thesis.
Thanks for your help.
Abdullah
Hi @Abdullah_BAS
Sorry for the delayed response. Unfortunately I am not sure as well. I tried going through and seeing if I could reconstruct the table from the paper. Potentially could be generated it from looking at the data descriptor and original publication to see how thresholds were established. Here is also the original OpenfMRI dataset for ds000030. Perhaps can be useful. I apologize for this.
Franklin
1 Like
Thanks for the link @franklin. I think you can find the information you need in the file ds000030/phenotype/bipolar_ii.tsv found in the first release of the dataset - https://s3.amazonaws.com/openneuro/ds000030/ds000030_R1.0.2/compressed/ds000030_R1.0.2_metadata.tgz
2 Likes
Thanks.
I looked to the bipolarii_sumscore of both control and bipolar subjects. As a matter of fact, I couldn’t see any differences among these groups (both groups have for example 1,3,5,15,25 etc). Hence, I couldnt determine any threshold. I will exclude the subgroup which involves Bipolar patients with Psychotic Feature.
Thanks for all your help @franklin and @oesteban .
I didnt realize the like button @franklin sorry.
-Abdullah
1 Like
