Parametric modulation with binary response (Nilearn)

Summary of what happened:

Dear all,
I did a task in which participants rated ambiguous faces as happy or sad, and I added the response as a parametric modulator. In my events file, I have trial_type, events, duration, response. Some response lines were empty because participants did not answer to all stimuli. I created a column “modulation”. Since it was 0 or 1, I did this :

events1 = pd.read_csv(path_fMRI+sub+‘/func/’+sub+‘_task-priming_run-1_events.csv’)
events1[‘modulation’] = events1[‘response’] - events1[‘response’].mean()
events2 = pd.read_csv(path_fMRI+sub+‘/func/’+sub+‘_task-priming_run-2_events.csv’)
events2[‘modulation’] = events2[‘response’] - events2[‘response’].mean()
event_files = [events1, events2]

Then I’ve just made my design matrix like this:

design_matrices =

for idx, img in enumerate(fmri_imgs):
events = event_files[idx]
motion = movements[idx]
n_scans = img.shape[-1]
frame_times = np.arange(n_scans) * t_r

design_matrix = make_first_level_design_matrix(
    frame_times,
    events,
    hrf_model=hrf_model,
    drift_model=drift_model,
    drift_order =drift_order,
    add_regs=motion.values,           
    add_reg_names=motion.columns.tolist()
)

design_matrices.append(design_matrix)

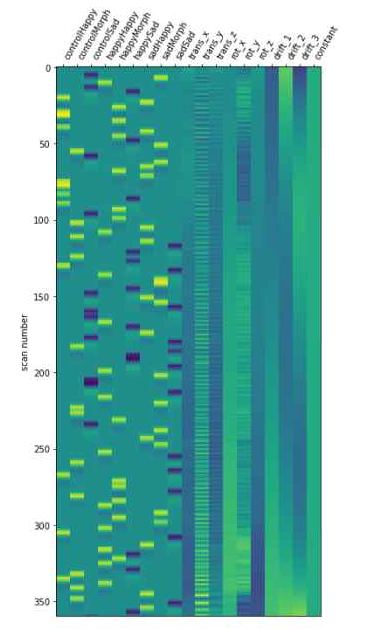
plot_design_matrix(design_matrices[1])

contrast_matrix = np.eye(design_matrix.shape[1])
conditions = {
column: contrast_matrix[i]
for i, column in enumerate(design_matrix.columns)
}

and know my modulation column has been taken into account because results make much more sense now that I added it and I’ve had this message: A ‘modulation’ column was found in the given events data and is used.

However, when I plot my design matrix, “modulation” does not appear! And I would like to extract the B of my modulator to see what drives how particpants respond to ambiguous faces as happy or sad, and have the psc in my ROIs!

Do you know if there is a way to extract it? Is there something wrong in the way I added the modulator?

Many thanks!!

Alexane


Hi,
AFAICT what you did looks right. Would you mind sharing the design matrix plot ?
Best,
Bertrand

Dear Bertrand,
Here is the design matrix:

Best,
Alexane

In your design matrix, some of the columns seem to be systematically negative, e.g. controlSad while others are systematically positive, e.g. controlHappy. Is it expected ? What do you call event 1 / event 2 ?
If you don’t mind sharing the events files, I could check whether all this is consistent.
Best,
Bertrand

Dear Bertrand,
It is indeed normal as controlSad and controlHappy are systematically sad and happy faces respectively that participants have to rate as either negative (0) or positive (1).
Please find attached is an example event file. (I had to convert it to txt for the platform to accept it)
Best,
Alexane
sub-02_task-priming_run-1_events_neurostars.txt (4.9 KB)

OK, so when you compute events1[‘modulation’] or events2[‘modulation’] what are the values you obtain there ? you should have something like +0.5 or -0.5, right ?
Best,
Bertrand

Pretty sure you did things right.

Adding a parametric modulation does not result in an extra column, it only “scales” the event “height” by the modulation.

I don’t think there is a GLM example with parametric modulation in the nilearn doc, but there is this example that shows how modulation is used to plot events in nilearn.

Maybe I am wrong but it seems that the way you set up your parametric modulation means that you expect that you are looking for regions that are ‘activated’ by ambiguous faces when subjects respond “happy” but ‘deactivated’ when they respond “sad”.

This seems like a fairly stringent model (it may be theoretically motivated, IDK).

Have you first looked at contrasting ambiguous trials depending on the answers given by the subject to see if there is any difference between those triels? Note this may lead to unbalanced design if your ambiguous stimuli do not lead to 50 % happy / 50 % sad response rate. Also it’s likely you won’t have great statistical power to see something.