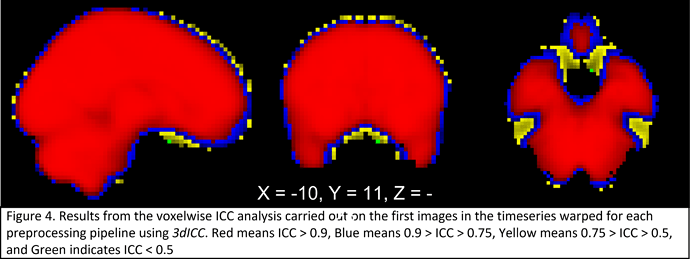
So I’m doing experiments comparing timeseries across multiple pre-processing methods and I’ve encountered something of an issue when it comes to comparing across each pipeline.
The scope of the experiment covers:
- Voxel-wise timecourses
- Seed-based timecourses
- ICA component timecourses
My concern is that different pipelines will change the underlying timecourses and subsequent correlations. While the latter doesn’t seem to be (significantly) affected in some approaches vs others (based on ICCs and linear-mixed models across correlations), I haven’t been able to come up with what I believe is an objective way to analyze changes in the images or timecourses themselves.
ICCs of the average timeseries and/or single band reference image from each pipeline suggest there isn’t much spatial change (see attached), but I also think this isn’t really getting at the issue.
I think there are a few ways to approach this and I wanted to get some opinions.
The first would be to do a standard voxelwise glm analyses on the data using a linear mixed-effect model, with pipeline as a repeated within-subject factor and participant as a random factor (I could also throw in things like age and gender if I want to see if those affected the processing), and then look for effects specific to preprocessing pipeline after a voxelwise correction. However, I don’t think there would be an equivalent approach for a seed or ICA timecourse
However, I’m curious about the idea of doing something I think will capture the spatial specificity of a voxelwise analysis while still being valid for seed-based and ICA based approaches. This would involve calculating similarity metrics (e.g. Pearson correlation, Euclidean distance, Tau, Sen’s slope, U*, see: R Handbook: Nonparametric Regression for Time Series and Four ways to quantify synchrony between time series data | by Jin, PhD | Towards Data Science) for timeseries pairs across each of the 30 pipelines (so 435 total measures), and then doing ICCs across the voxel, seed, and ICA measures with these 435 values (per participant) serving as the “judges.”
Any thoughts or comments on these differing approaches would be appreciated.
