Plot_stat_map shows strange colormap behavior when plotting a thresholded image

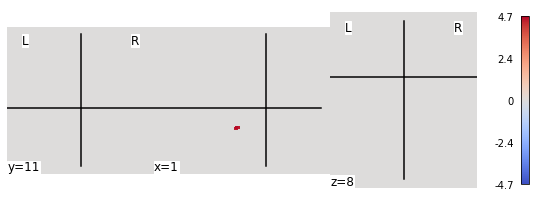
I use nistats to perform a second-level analysis on sMRI data. I am using nistats.thresholding.map_threshold in order to obtain both an unthresholded statistical image and a corresponding threshold for this image. In my script I first used nilearn.plotting.plot_stat_map to plot my thresholded image (with threshold == 'None'):

plotting.plot_stat_map(stat_map_img=z_img_thresholded,
                       colorbar=True,
                       symmetric_cbar=True,
                       cmap='coolwarm',
                       threshold=None,
                       cut_coords=[1,11,8])

However, this returns the following plot:

Figure_1

However, when I used the unthresholded image and provided the corresponding threshold, the plot ‘looked fine’:

plotting.plot_stat_map(stat_map_img=z_img,
                       colorbar=True,
                       symmetric_cbar=True,
                       cmap='coolwarm',
                       threshold=threshold,
                       cut_coords=[1,11,8])

Figure_2

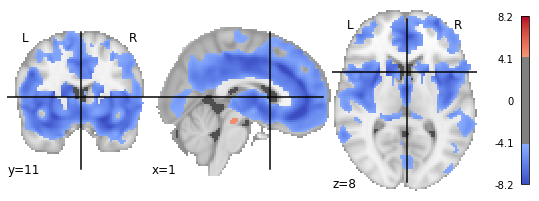
This problem seems to have something to do with the used colorbar. Intuitively, I would expect both functions to plot the same plot, as plotting an already thresholded image vs. plotting an unthresholded image + providing the corresponding threshold is logically the same. Did I use the functions wrong, is this behavior wanted, or is this a bug?

can you try threshold=1e-6 ?

plotting.plot_stat_map(stat_map_img=z_img_thresholded,
                       colorbar=True,
                       symmetric_cbar=True,
                       cmap='coolwarm',
                       threshold=1e-6,
                       cut_coords=[1,11,8])

returns:

image

With this, the background image ‘reappears’ but the colorbar scale is still different (-4.7 - 4.7 vs. -8.2 - 8.2)

thanks! can you also set vmax=8.2, or whatever other value

plotting.plot_stat_map(stat_map_img=z_img_thresholded,
                       colorbar=True,
                       symmetric_cbar=True,
                       vmax=8.2,
                       cmap='coolwarm',
                       threshold=1e-6,
                       cut_coords=[1,11,8])

returns:
image

thanks! it seems the thresholding kept only the positive part of the image

indeed looking at nistat’s code I don’t see negative values being handled
how did you call map_threshold?

actually this seems to have changed with nistats commit 6447ce1b39f3bd680daf1ccb0d3def6de653b177

if you pull nistats master and use the two_sided argument when calling map_threshold that should fix the problem

I call map_threshold with the following arguments.

ALPHA = 0.05
TWO_SIDED = False
HEIGHT_CONTROL = ‘fdr’
CLUSTER_THRESHOLD = 0

z_img_thresholded, threshold = map_threshold(stat_img=z_img,
                                                 mask_img=sdm_mask_mni,
                                                 alpha=ALPHA,
                                                 height_control=HEIGHT_CONTROL,
                                                 cluster_threshold=CLUSTER_THRESHOLD,
                                                 two_sided=TWO_SIDED)

So I am already using the latest version 0.0.1b2

don’t you need two_sided=True ?

That ‘solved’ the problem. Calling map_threshold with two_sided=True and then calling

plotting.plot_stat_map(stat_map_img=z_img_thresholded,
                       colorbar=True,
                       symmetric_cbar=True,
                       vmax=8.2,
                       cmap='coolwarm',
                       threshold=1e-6,
                       cut_coords=[1,11,8])

outputs:

image

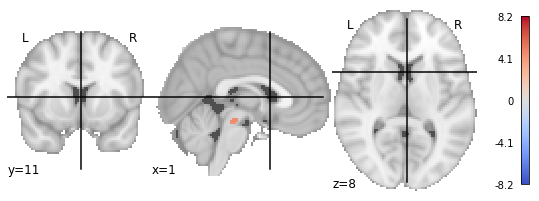
However, this leaves me with the problem of my earlier post. @bthirion suggested to use two_sided = False, that’s why I used that setting for the analysis.

In general, in my analysis, I have specific hypotheses concerning the effect of groups, age and gender on grey matter density (older people have less grey matter densities, males have more than females, patients less than controls). Statistically, that would allow me to use a one-tailed-test, which means I am ‘allowed’ to divide my observed p-value by 2. I wanted follow this logic for my analyses.

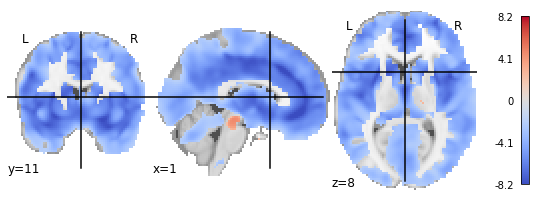
When using two_sided == True it seems that the p-value is multiplied by the factor of 2, which follows a similar logic in the opposite direction (the test becomes more sensitive)

two_sided: Bool, optional,
Whether the thresholding should yield both positive and negative part of the maps. In that case, alpha is corrected by a factor of 2. Defaults to True.

I am not exactly sure, why two_sided controls the presence or absence of positive and negative values. Wouldn’t it make more sense to always present negative and positive values and let two_sided only control the final value for my p-value?

I think you’re right, and this is the object of issues #444


If I’m not mistaken.

Sorry for introducing that bug. I need to work on the fix.