Hi,
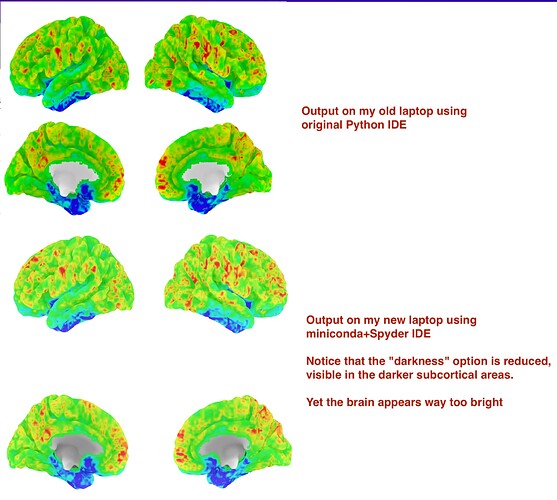
I have the problem that the plots or Figures created via nilearn’s plotting.plot_img_on_surf appear way too bright when plotting with the Spyder IDE. It looks as if the gamma of the picture is way too high.
I know that one can adjust the brightness of the images via darkness=value,, where a higher or lower value decreases and increases the plot’s brightness, respectively. However, that does not solve the problem. While the brightness slightly changes, especially noticeable in the white subcortical areas of the brain, the “background gamma” brightness remains way too high, no matter what values I choose.
I did not face this problem on my old laptop where I used the standard Python IDE. I am on a Mac, using miniconda with Sypder IDE.
Is this a bug or compatibility problem between nilearn and the Spyder IDE? Is there a way to fix this problem? Any changes within the Spyder IDE options did not affect or solve the plot brightness. This problem does not appear for any other plots or figures, but only in this specific case using plotting.plot_img_on_surf.
I attach an image that shows (1) the plotted image on my old laptop using Python IDE (normal brightness or gamma of the picture) and (2) the other image shows the current but way too bright image with my new setup.
Here is my code:
# Data
nifti = nilearn.image.load_img(f"/volumes...")

# Cortical mesh
mesh = datasets.fetch_surf_fsaverage(mesh=plot,
                                     data_dir="/users/...")

# Plot
vmax = 0.55
fig, axes = plotting.plot_img_on_surf(stat_map=nifti,
                                      surf_mesh=mesh,
                                      threshold=0.001,
                                      views=["lateral", "medial"],
                                      hemispheres=["left", "right"],
                                      inflate=False,
                                      bg_on_data=True,
                                      colorbar=True,
                                      vmax=vmax,
                                      darkness=0.5,
                                      antialiasing=True,
                                      cmap=range_cmap)
Thanks for any help or info, as I really cannot find the source of the problem.
