I am trying to use nilearn to plot some t maps over a brain template. I have 2 maps and I’d like to plot the activations over the same template, possibly binarising the acvitation maps (meaning I do not need a colour map, I just need to plot one t map in blue and the other one in red) and possibly plot in a third colour the overlap between the two activations.
Has any of you ever done something like that?
Another thing that I cannot do with nilearn is to use asymmetric maps instead of symmetric ones. Any solution for that? The argument symmetric_cbar of the function plot_stat_map does not seem to be working.
Hello I’ve seen this done but cant remenber how. It’s definitely not a feature but can be done. Unless someone comes up with a better solution you can hack the atlas plotting functions that plot different labels in different color.
Either binarize both contrasts and input the voxel activated for each of them in the same 3D nifti with labels 1 and 2, then plotting.plot_roi should work.
Or threshold images, normalize them to values between 0 and 1, concatenate them into a 4D nifti and use plotting.plot_prob_atlas
Re. symmetric cmaps, plot_stat_map will not, by design, produce plot with an asymmetric cmap (I think mostly to make sure maps that use 2 hues for negative and positive, eg blue and red, stay centered on 0). But you can used directly nilearn.plotting.plot_img which is less specialized and more flexible.
symmetric_cbar has no effect on the colormap but only on the colorbar, which can be truncated to only show the portion of the colormap from vmin to vmax, or show the full colormap from -absvmax to absvmax
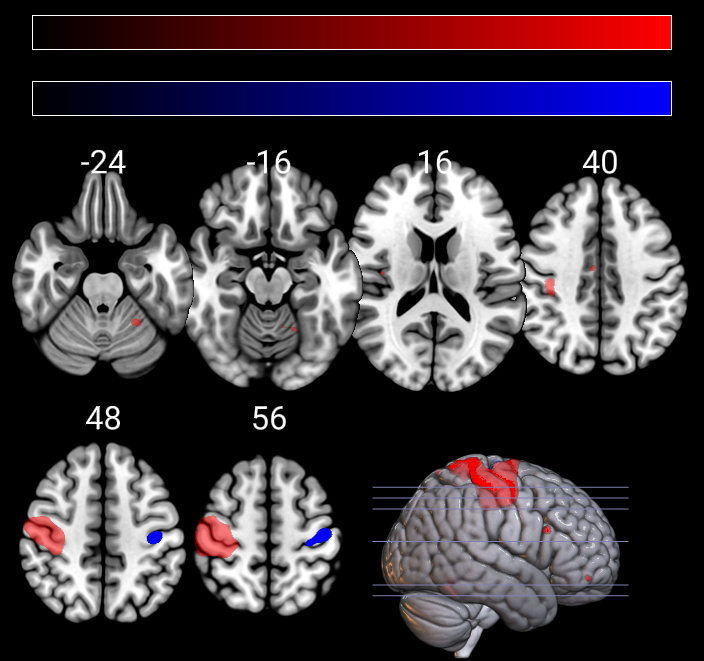
MRIcroGL would be an alternative to nilearn. The command “minimal” sets the minimum and maximum intensity for a layer. Setting the minimum and maximum to the save value creates a binary threshold: each voxel either survives or does not survive the threshold. Several default Python scripts are provided in the Scripting/templates menu item. Here is an example of the mosaic script that loads two overlays and applies a binary threshold to each:
import gl
gl.resetdefaults()
#open background image
gl.loadimage('spm152')
#open overlay: show positive regions
gl.overlayload('spmMotor')
gl.minmax(1, 4, 4)
gl.opacity(1,50)
#open overlay: show negative regions
gl.overlayload('spmMotor')
gl.minmax(2, -4, -4)
gl.colorname (2,"3blue")
gl.mosaic("A L+ H -0.2 -24 -16 16 40; 48 56 S X R 0");
Thanks! Can I also ask you if you know how to load a region of interest from the scripting panel, in order to show results only from a specific region?
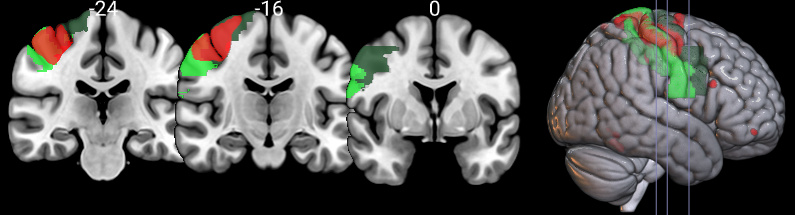
You can see a listing of all the inbuilt functions by choosing the Scripting/Templates/help menu item. These functions are designed for visualization, not image processing. Therefore, I think you would want to write a generic python script to mask voxels in a statistical template. Related to your question are the gl.atlasshow and gl.atlashide functions that only display specific regions of an atlas, in the example below I am only showing the right pre central and post central regions from the AAL atlas (in green) and showing the statistical overlay on top in red.
import gl
gl.resetdefaults()
gl.loadimage('spm152')
gl.overlayload('aal')
gl.atlasshow(1, (58, 2))
gl.opacity(1,80)
gl.overlayload('spmMotor')
gl.minmax(2, 4, 4)
gl.colorname(2,'1red')
gl.opacity(2,80)
gl.overlaymaskwithbackground(1)
gl.mosaic("C L+ H 0.2 -24 -16 0 S X R 0")