For my sMRI analysis, I would like to plot the extracted components derived from sklearn.decomposition.PCA , similar to the examples given for nilearn.decomposition.CanICA. Is it possible to do this using nilearn and sklearn?
Here’s an example code using the OASIS dataset. My pipeline following a similar approach (1. masking using NiftiMasker, 2. standardizing the data matrix and 3. running the PCA):
## set workspace
import numpy as np

from nilearn.datasets import fetch_oasis_vbm
from nilearn.input_data import NiftiMasker
from nilearn.image import index_img

from sklearn.preprocessing import StandardScaler
from sklearn.decomposition import PCA
from sklearn.pipeline import Pipeline

from nilearn import plotting

## Custom Settings ############################################################

niftimasker_cache = './niftimasker_cache/'

# set user defined variables
RANDOM_SEED=42
SMOOTHING_FWHM=8
PCA_EXPL_VAR=0.8
PCA_SVD_SOLVER='full'
LR_PENALTY='l2'

## Load Data  #################################################################

oasis_dataset = fetch_oasis_vbm(n_subjects=100)
ext_vars = oasis_dataset.ext_vars

mmse = ext_vars['mmse']
imgs = np.array(oasis_dataset['gray_matter_maps'])
imgs = imgs[((mmse > 29) | (mmse < 5)) & (mmse != -1)]

## PIPELINE ###################################################################

# create a random number generator
rng = np.random.RandomState(RANDOM_SEED)

# Convert Images to Data Array ###############################################

niftimasker = NiftiMasker(smoothing_fwhm=SMOOTHING_FWHM,
                          mask_strategy='template')

# z-standardize images
scaler = StandardScaler()

# PCA
pca = PCA(n_components=PCA_EXPL_VAR,
          svd_solver=PCA_SVD_SOLVER,
          random_state=rng)

# create pipeline
pipe = Pipeline([('niftimasker',niftimasker),
                 ('scaler',scaler),
                 ('pca',pca)])

# call fit_transform on pipeline
X = pipe.fit_transform(imgs)

# inverse_transform pipeline (this will output a 4D image with one
# slice in the fourth dimension (x,y,z,1). using index_img gives as a 3D image
# (x,y,z)
img_inverse_transformed = pipe.inverse_transform(X)
img_inverse_transformed = index_img(img_inverse_transformed,0)

# plot loadings
plotting.plot_stat_map(img_inverse_transformed)
which gives you:
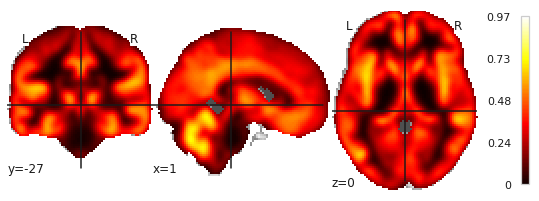
1.) Do I interpret correctly, that this gives me the image with the PCA loadings?
Note here, that OASIS is a ‘bad’ example, in my project, this image looks like this:
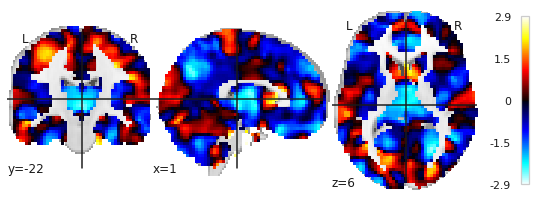
2.) As I mentioned above, I would like to obtain separate images for each component or even better, plotting all components using different colors in the same figure.