Hello!
I would like to find a way of plotting my DCM (effective connectivity) results in python, specifically with nilearn.
I have used the functions to plot and view connectomes, however, those function don’t seem to work with asymmetric matrices (which are what I get as results of a DCM).
I am aware that with how nilearn plot connectomes at the moment, it’s not possible to plot asymmetric graphs.
However I would like to achieve something similar as what I get with those functions. Ideally, I would like to find a way to “curve” the lines a bit, this way I could plot 2 lines for each node (to account for the directionality of my links between nodes). Does this make sense? Has anyone done something similar to what I want to achieve?
Thanks a lot!
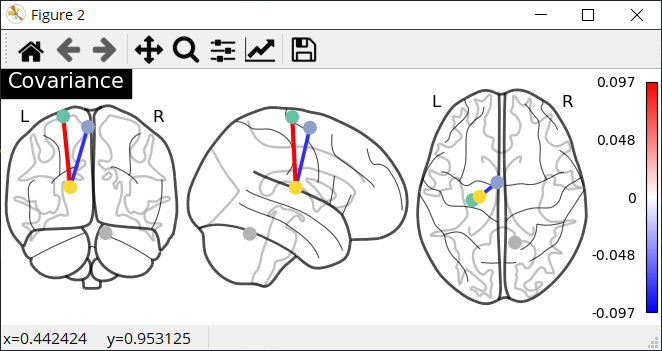
Here I have attached what I get when I conver my matrix from asymmetric to symmetric, but it’s not quite what I want to achieve.
Best,
Davide