Hi all,
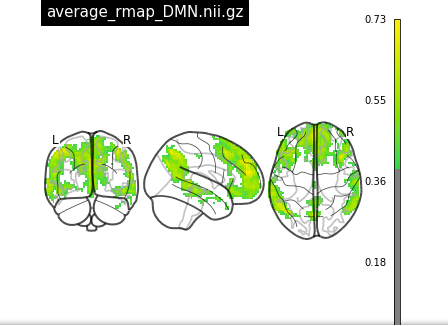
I’m trying to visualize my data. I’m using plotting.plot_glass_brain
My code :
#Print all the images
image =['average_rmap_CER.nii.gz','average_rmap_DMN.nii.gz','average_rmap_FP.nii.gz','average_rmap_LIM.nii.gz',
     'average_rmap_MOTOR.nii.gz','average_rmap_VAT.nii.gz','average_rmap_VIS.nii.gz','rmap_sub02_CER.nii.gz',
     'rmap_sub02_DMN.nii.gz','rmap_sub02_FP.nii.gz','rmap_sub02_LIM.nii.gz','rmap_sub02_MOTOR.nii.gz',
     'rmap_sub02_VAT.nii.gz','rmap_sub02_VIS.nii.gz','rmap_sub04_CER.nii.gz','rmap_sub04_DMN.nii.gz',
     'rmap_sub04_FP.nii.gz','rmap_sub04_LIM.nii.gz','rmap_sub04_MOTOR.nii.gz','rmap_sub04_VAT.nii.gz',
     'rmap_sub04_VIS.nii.gz','rmap_sub05_CER.nii.gz','rmap_sub05_DMN.nii.gz','rmap_sub05_FP.nii.gz',
     'rmap_sub05_LIM.nii.gz','rmap_sub05_MOTOR.nii.gz','rmap_sub05_VAT.nii.gz','rmap_sub05_VIS.nii.gz']

for i in image :
b = "/Users/bims1/Documents/projects/connectivity/connectomes/rmap_seeds/" + i
DMN_gen = plotting.plot_glass_brain(b, draw_cross = True, colorbar=True, threshold = 0.3, title = i, cmap = 'viridis')
plt.show(b)
plt.gcf().clear()
Can I change the size of my figures ? Their emplacement on my screen ? Now it’s one after the other vertical, but I might want to put them 2 on the same line ?
I looked in to the function plotting.plot_glass_brain and in plt.show() but I found nothing.
Thanks for your help
