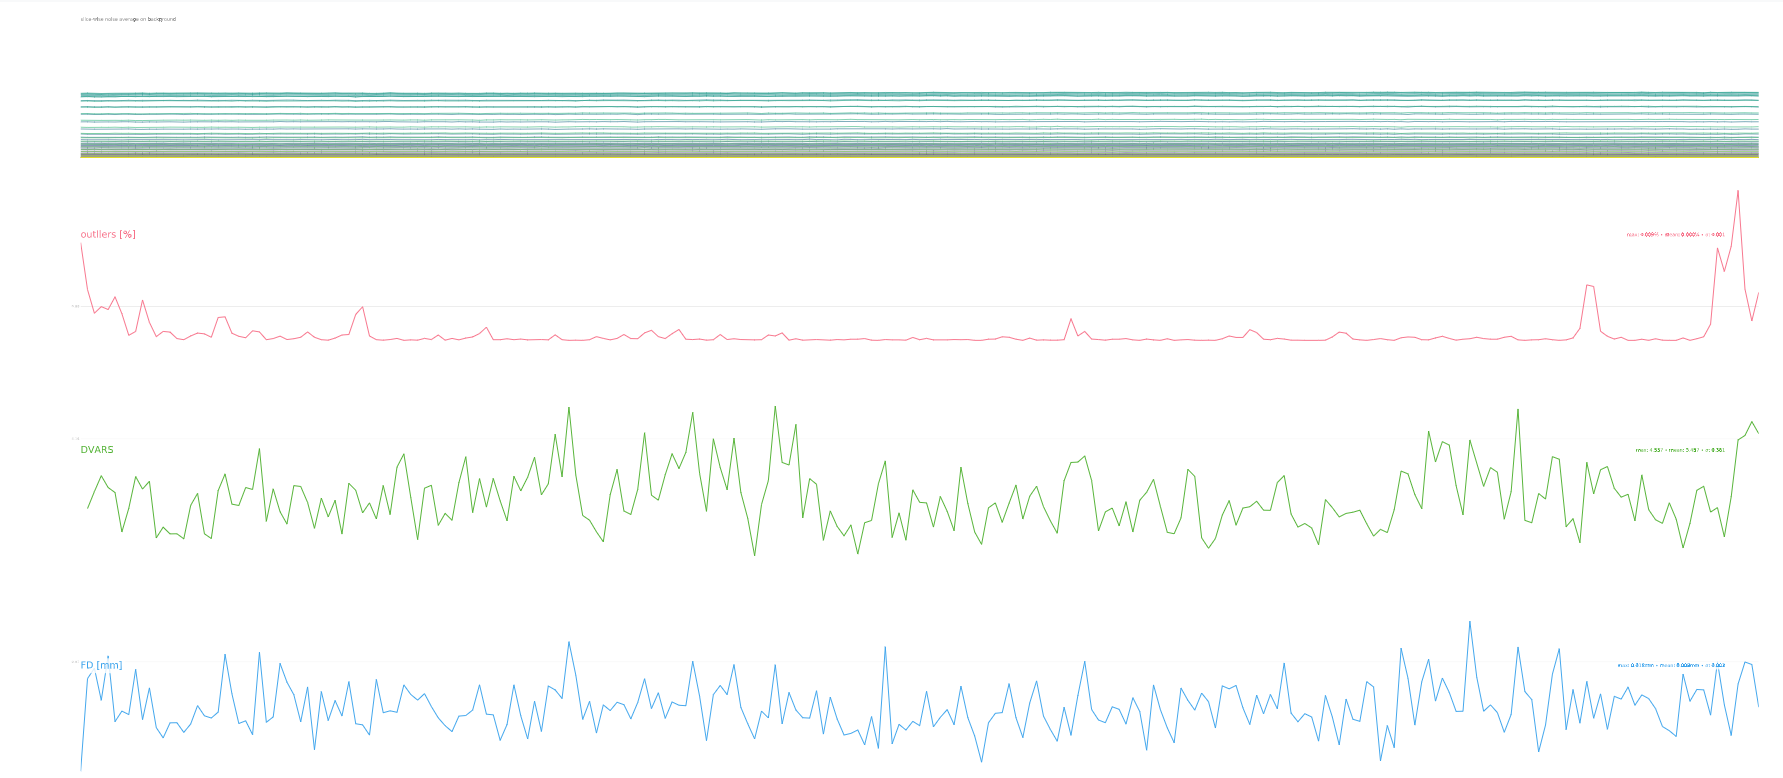
Hello. I used MRIQC to test the quality of resting state fMRI images. The visual reports I got in html format are not exactly as they are shown on their website (https://mriqc.readthedocs.io/en/stable/reports/bold.html#visual-reports). In my reports, I think the plots have missing y-axis values. Moreover, the labels/text mentioned in the plots are so minute that they are not decipherable. I am attaching the screenshot here. I tried to zoom in and also opened with two different browsers (chrome and internet explorer) but no change.
Could anyone please suggest anything or am I doing anything wrong?