Hello everyone,
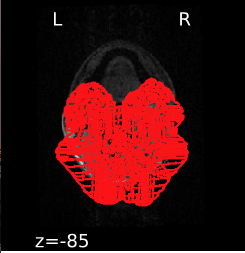
I am running mriqc with singularity on a server cluster and everything works fine, except that I ran into some issues with the additional plots appended to the participant-level reports when providing the --verbose-reports argument. Specifically, the animations visualising co-registration to MNI space are blank (i.e. it shows everything except for the brain slices themselves) for both T1w and bold images. Furthermore, the brain mask and brain tissue segmentation plots display implausible (random) red outlines for the first three slices for T1w reports while the rest of the slices look as expected (This problem only occurs for one of the datasets I tested however).
When running the T1w reports I receive the following output log. The first line I always get when running mriqc, but the second one is specific to the --verbose-reports argument:
/usr/local/miniconda/lib/python3.6/site-packages/grabbit/core.py:410: UserWarning: No valid root directory found for domain ‘derivatives’. Falling back on the Layout’s root directory. If this isn’t the intended behavior, make sure the config file for this domain includes a ‘root’ key.
“‘root’ key.” % config[‘name’])/usr/local/miniconda/lib/python3.6/site-packages/matplotlib/contour.py:1173: UserWarning: No contour levels were found within the data range.
warnings.warn(“No contour levels were found”
When running the bold reports I don’t receive this warning but a different one:
mriqc.report:WARNING Building bold report: no exclude index was found
I hope someone knows a solution to this problem and I appreciate your help.
Kind regards,
Alex