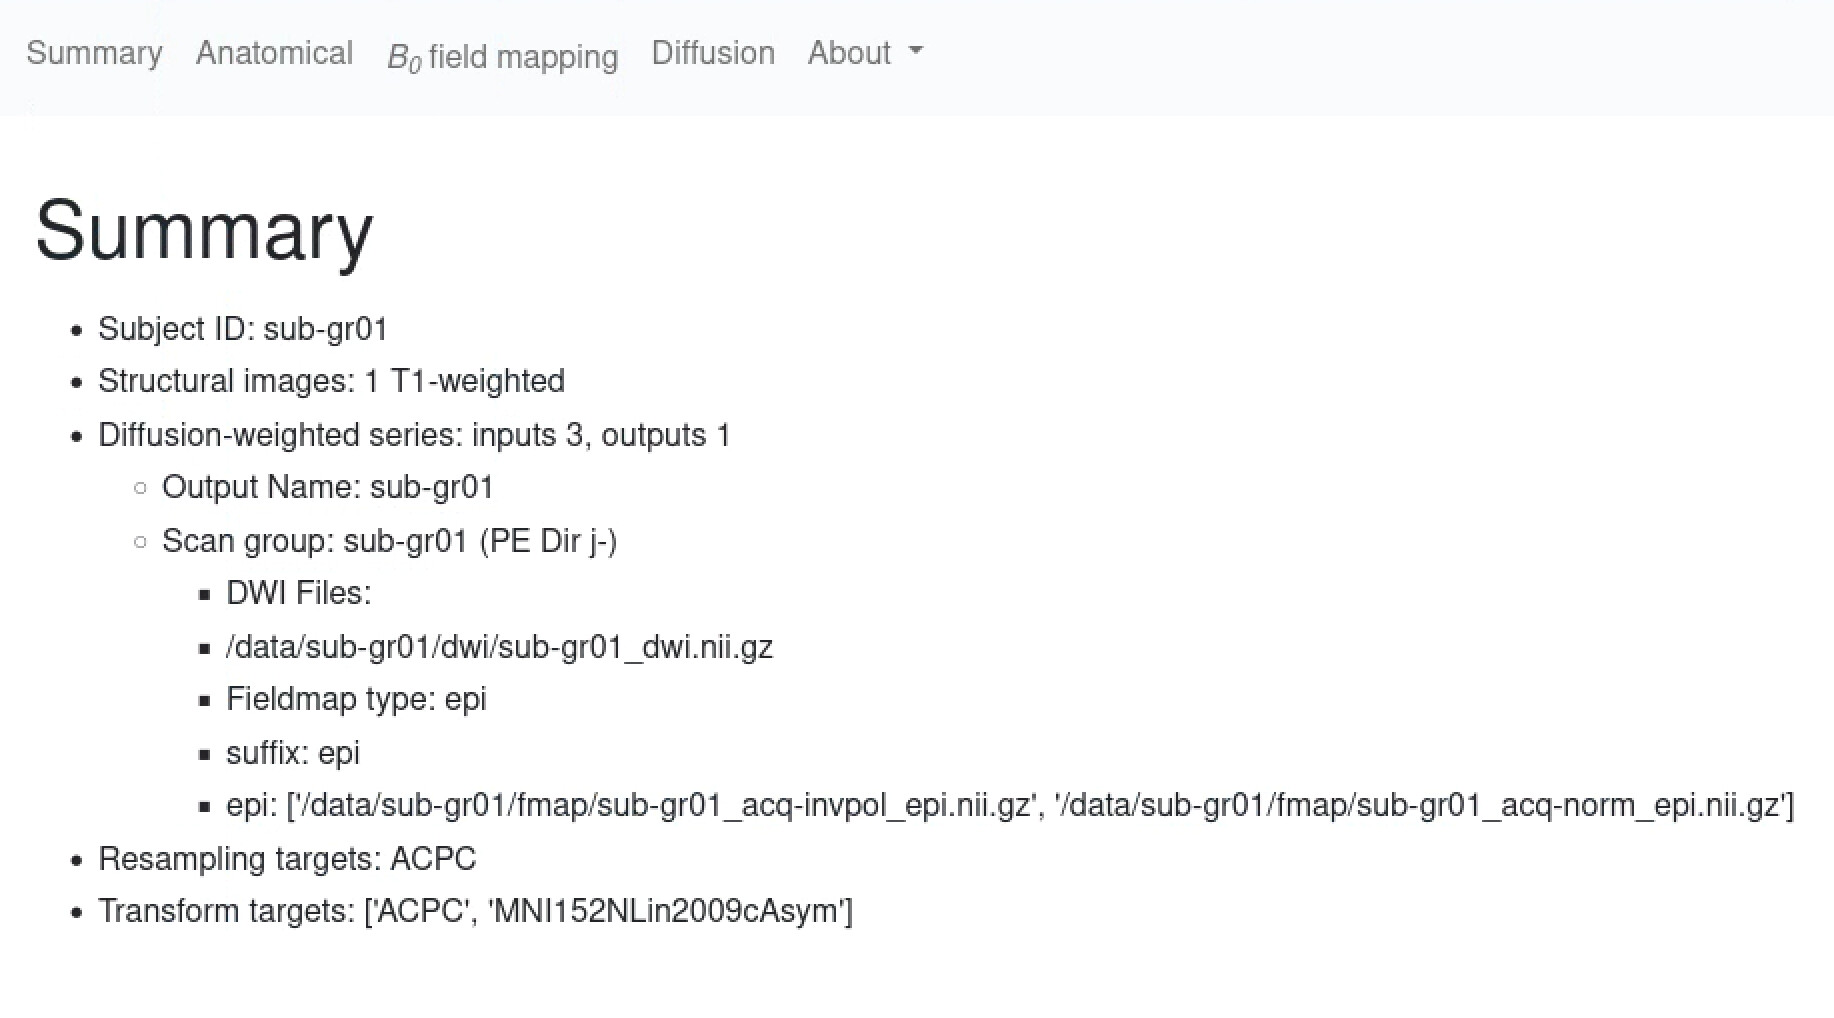
Summary of what happened:
I’ve (seemingly) successfully preprocessed the data from one participant using a singularity container of qsqiprep. However, I know from previous usage of the software that the HTML output file generated should include a q-space sampling illustration and the output of this run does not. It is not clear to me why? Do I need to pass a particular flag to the call of the singularity image / qsiprep or is there any other (obvious) reason as to why this information is missing?
Command used (and if a helper script was used, a link to the helper script or the command generated):
singularity run --cleanenv -B $BIDS_DIR,$W_DIR,$QSI_OUT,$SOFTWARE_DIRS /data/software/qsiprep-1.0.0rc1.sif $BIDS_DIR $QSI_OUT participant -w $W_DIR --participant-label <label> --skip-bids-validation --output-resolution 1.7 --fs-license-file $FS_LICENSE --resource-monitor --nthreads 16 --stop-on-first-crash
Version:
1.0.0rc2.dev0+g789be41.d20241119
Environment (Docker, Singularity / Apptainer, custom installation):
Singularity container, created from Docker image according to instructions on web site.
Data formatted according to a validatable standard? Please provide the output of the validator:
BIDS validator gives no error message.
Relevant log outputs (up to 20 lines):
Diffusion data preprocessing
Any images with a b-value less than 100 s/mm^2 were treated as a b=0 image. MP-PCA denoising as implemented in MRtrix3’s dwidenoise(Veraart et al. 2016) was applied with a auto-voxel window. When phase data were available, this was done on complex-valued data. After MP-PCA, the mean intensity of the DWI series was adjusted so all the mean intensity of the b=0 images matched across eachseparate DWI scanning sequence. B1 field inhomogeneity was corrected using dwibiascorrect from MRtrix3 with the N4 algorithm (Tustison et al. 2010) after corrected images were resampled.
FSL (version None)’s eddy was used for head motion correction and Eddy current correction (Andersson and Sotiropoulos 2016). Eddy was configured with a q-space smoothing factor of 10, a total of 5 iterations, and 1000 voxels used to estimate hyperparameters. A linear first level model and a linear second level model were used to characterize Eddy current-related spatial distortion. q-space coordinates were forcefully assigned to shells. Field offset was attempted to be separated from subject movement. Shells were aligned post-eddy. Eddy’s outlier replacement was run (Andersson et al. 2016). Data were grouped by slice, only including values from slices determined to contain at least 250 intracerebral voxels. Groups deviating by more than 4 standard deviations from the prediction had their data replaced with imputed values.
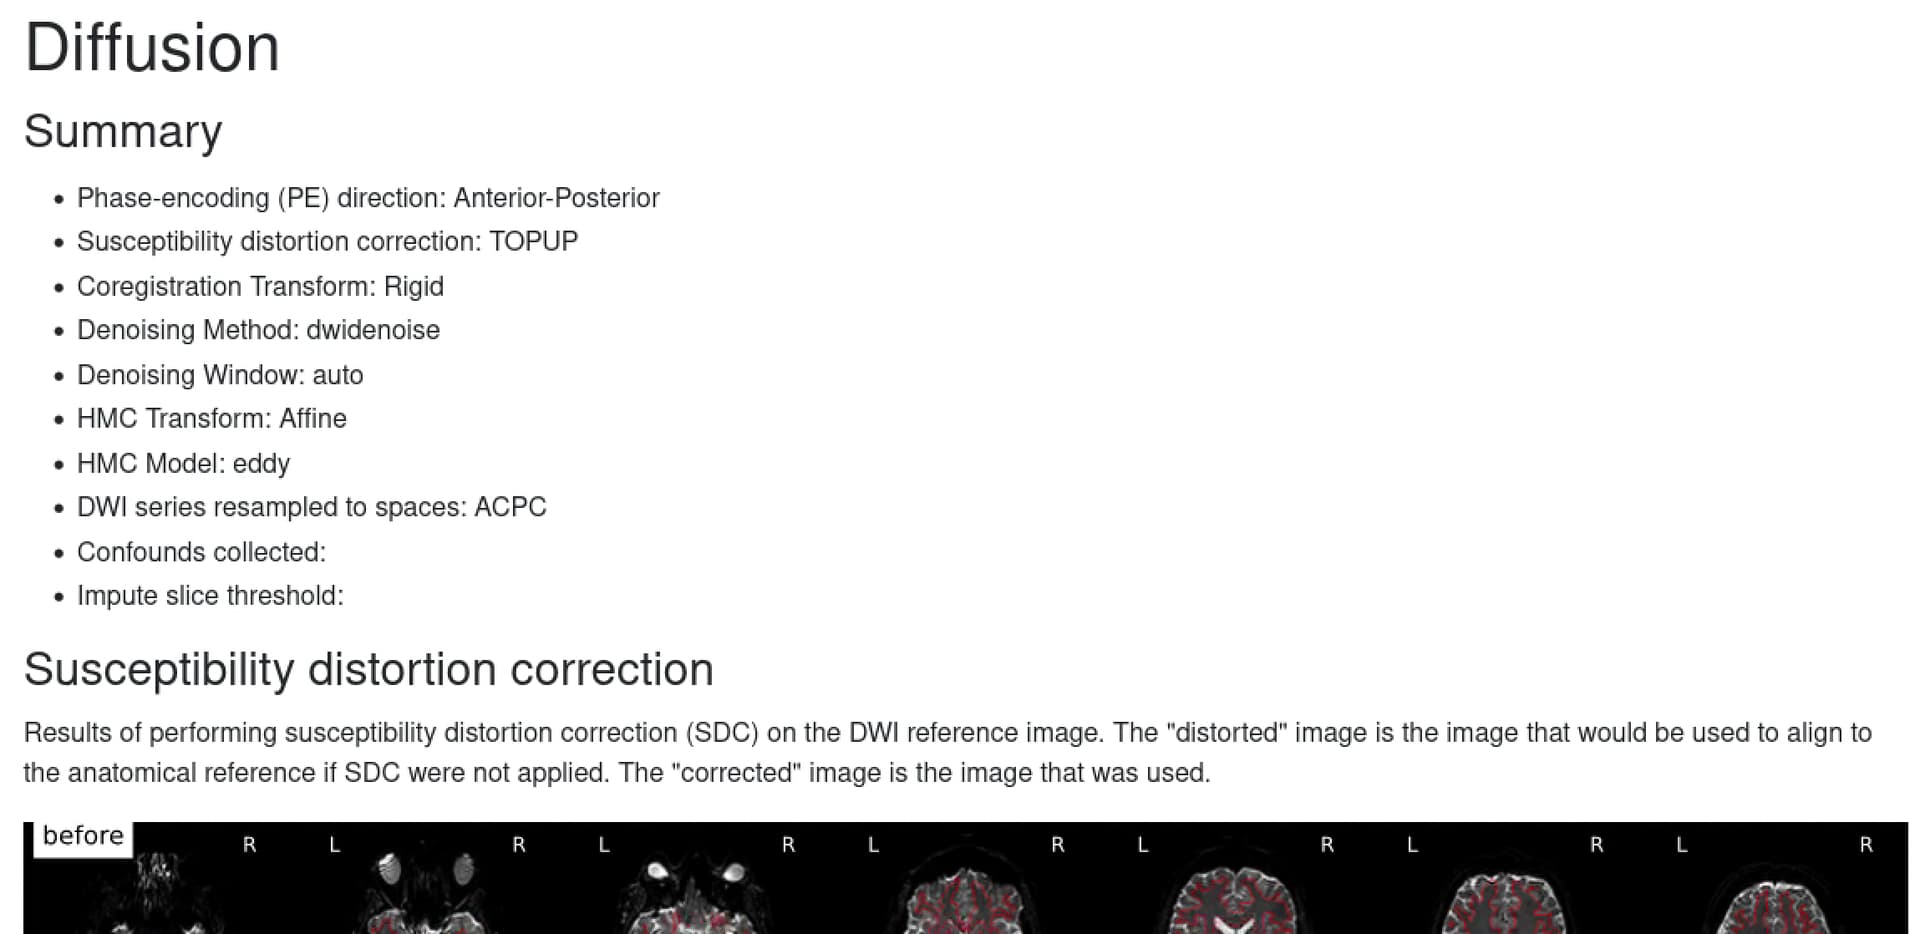
Data was collected with reversed phase-encode blips, resulting in pairs of images with distortions going in opposite directions. FSL’s TOPUP (Andersson, Skare, and Ashburner 2003) was used to estimate a susceptibility-induced off-resonance field based on b=0 reference images with reversed phase encoding directions. The TOPUP-estimated fieldmap was incorporated into the Eddy current and head motion correction interpolation. Final interpolation was performed using the jac method.
Several confounding time-series were calculated based on the preprocessed DWI: framewise displacement (FD) using the implementation in Nipype (following the definitions by Power et al. 2014). The head-motion estimates calculated in the correction step were also placed within the corresponding confounds file. Slicewise cross correlation was also calculated. The DWI time-series were resampled to ACPC, generating a preprocessed DWI run in ACPC space with 1.7mm isotropic voxels.
Many internal operations of QSIPrep use Nilearn 0.10.1 (Abraham et al. 2014, RRID:SCR_001362) and Dipy (Garyfallidis et al. 2014). For more details of the pipeline, see the section corresponding to workflows in QSIPrep’s documentation.