Hi all, apologies for spamming this space with questions. I am new to using rapidtide and am trying to get a better understanding of what is happening under the hood. The question I have here is related to the —searchrange flag/its theory of operation. I went through the rapidtide documentation on what this flag does/how it works but had some lingering questions.
Data and base command: I am extracting whole brain lags for multi-band rsfMRI data (TR=0.46s). My cohort includes young (20s) and older adults (60+). As a starting point, I processed 10 subjects across this age range (their brains looked fairly healthy - no obvious pathology), using this base command:
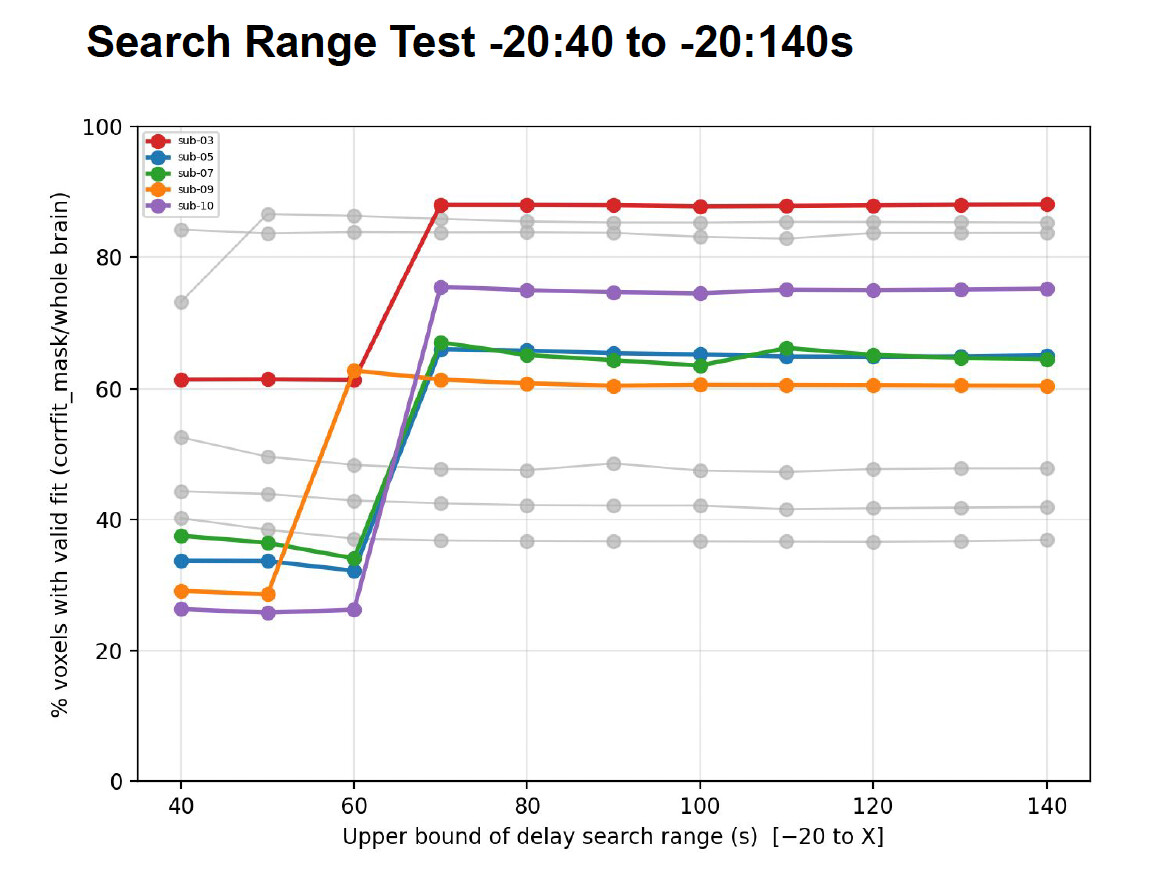
What I tested: I re-ran this command, expanding only the upper limit of the search range, from -20:40 all the way to -20:140s. I then plotted the % of voxels that were determined to have a “valid fit” (corrfit_mask/brainmask) across each search-range window.
Result:
I noticed that as I increased the upper bound, some subjects had this sharp jump in % of voxels with a valid fit. Note: These subjects were of various age groups (some young, some old).
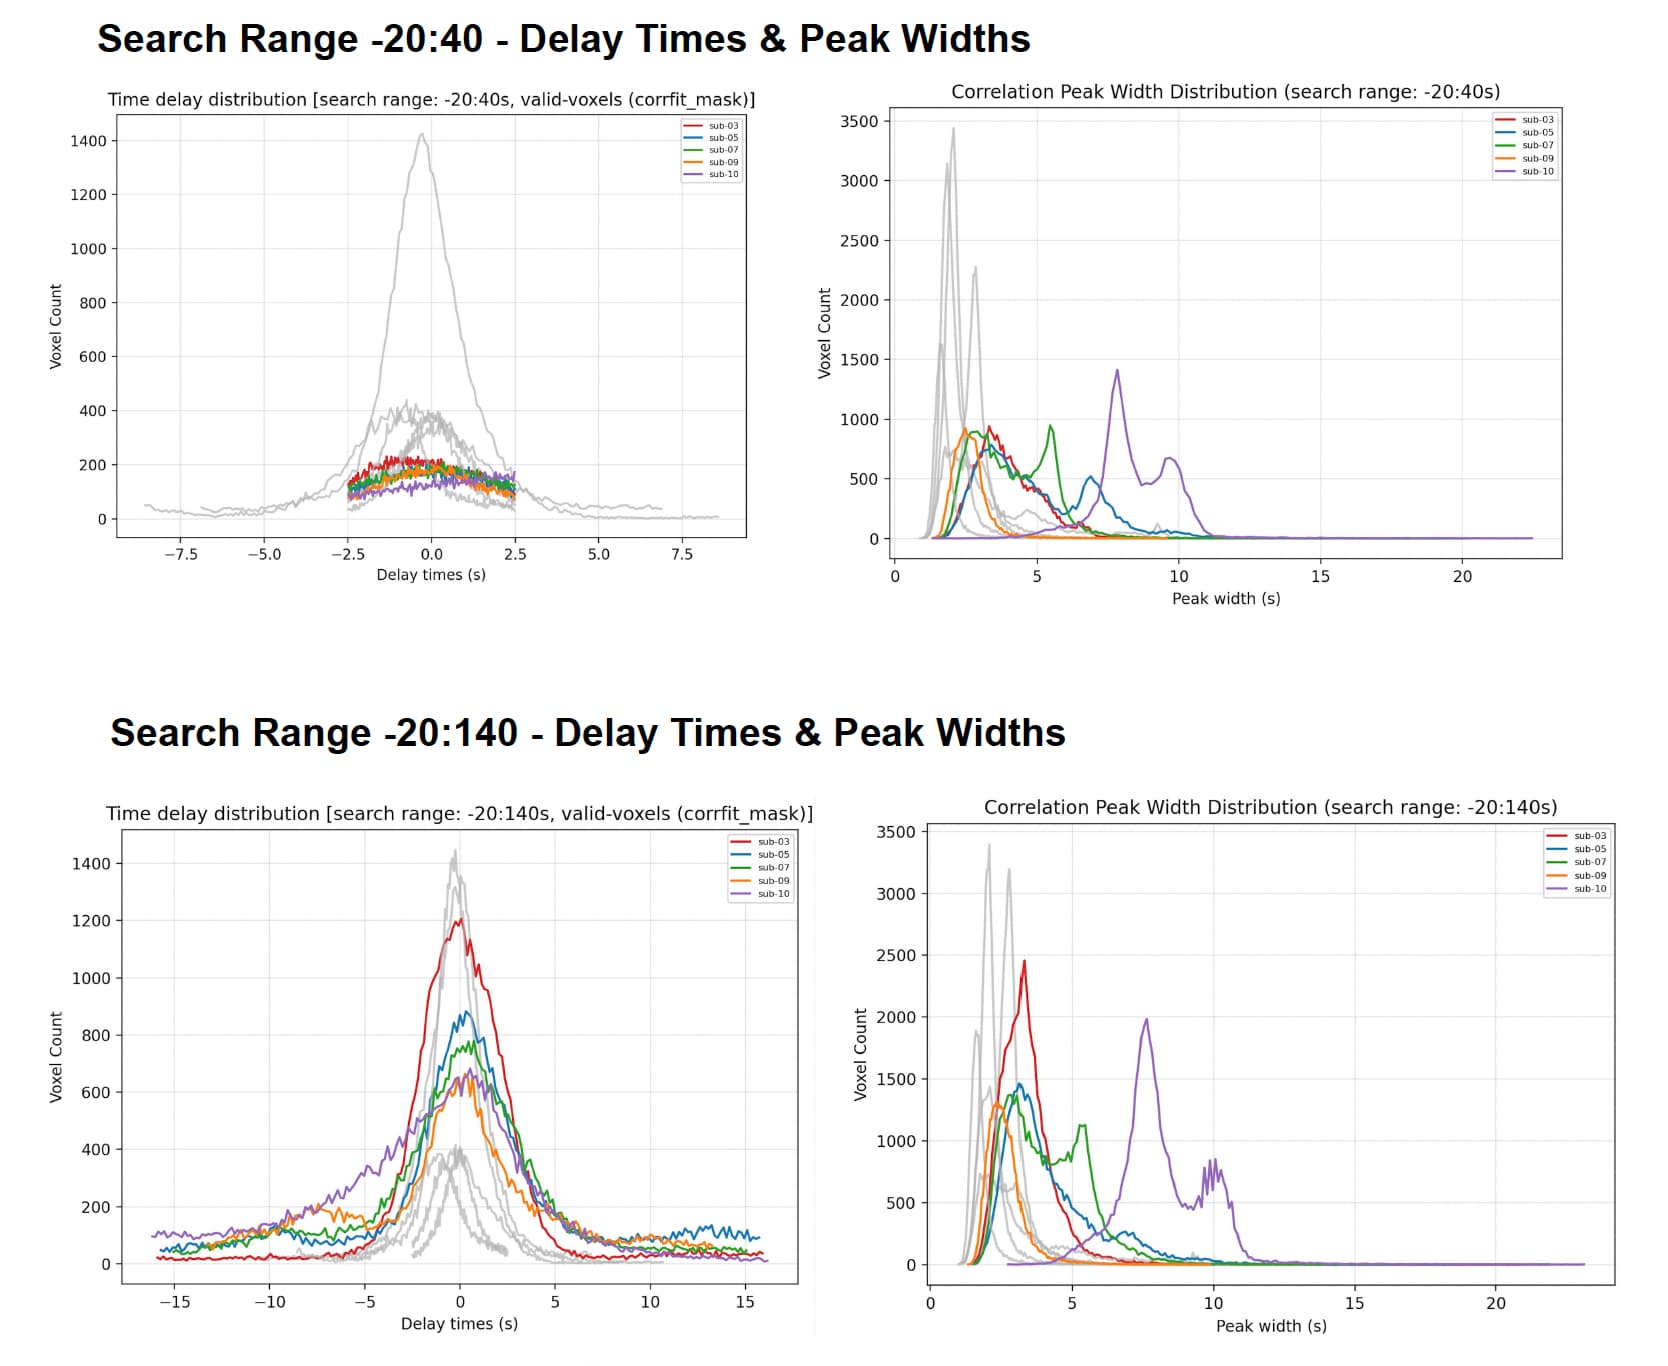
When plotting a histogram of delay times (-20:40s) vs (-20:140s) for the few that jumped, I noticed that while the % fit increased, the distribution of delay times did not really increase. What was odd was that the window of -20:40 picked up delays of max +/- 7 sec, but a window of -20:140s picked up delays of +/- 15 sec. This was weird, and I wondered if those additionally detected delays were spurious fits.
I plotted the peak widths for those few subjects, and noticed they were a little broad. The similarity metrics (per runqualitycheck were also centered around 0.3-0.6).
Questions:
Is the pattern I’m seeing spurious? Would it be advisable to keep the search range as wide as possible just to get more fits - or is that hacky?
In the runqualitycheck section of the documentation, would it be possible to provide some notes on how to quality check the lag maps? And what you should definitely flag as a fail?
(Sidenote:
I also checked the probe regressor time course - I noticed the documentation said that folks can take a solid 60-70s to settle into the scanner, and that might be why setting a long search range is picking up more fits? I tried toggling with —simcalcrange 130 -1 (60s onwards) at the -20:40s search window, but this did not really improve the % of fits so I dropped that. I also tried a few runs with the motion file (6 confounds) supplied. This did not really improve the % of fits either.
I am currently running some subjects with obvious pathology (CSVD-like/stroke lesions), to see if a wide window picks up longer delays as literature has previuosly shown, maybe this would justify a large window, but I’m not sure).
Apologies for the wall of text. I would greatly appreciate any thoughts on this, thanks!
That seems like a very cool dataset - there’s lots of things you could try with that.
A couple of things:
How long is your acquisition? I’m just curious. It is true that I find that tossing the first 60 seconds or so with simcalcrange does make the delay fits a bit more stable. I’d leave it on - you said it didn’t improve things, but it probably didn’t hurt.
Your subjects 7 and 10 look a little odd - the correlation peak widths are way higher than I’m used to seeing.
I usually find that setting the lower end of set range too low can cause odd behavior. While there are lots of things that delay blood arrival, almost nothing can make it much faster than the average, since there are a lot of places that get blood quickly. Try changing -20 to -7.5 or even -5 and see if that improves things.
Unless people have fairly major pathology (recent stroke, moyamoya), I don’t think you need to go out as far as 140 seconds. -5:40 should be sufficient for most people.
Have you looked at the corrout files? That shows the correlation function for each voxel - that can be helpful in understanding strange behavior. tidepool shows the correlation function in each voxel, and lets you play the corrout file as a movie, so that might help you to understand what’s going on in the subjects with very broad peak widths.
The discontinuity in valid voxels with increasing search range is pretty odd - a 70% failure rate at the low end is not what I’d expect. The failreason map would probably be informative.
Could you send a representative maxtime and maxcorr map? Also a corrfit mask. It would be helpful to know where the fits are succeeding and where the are failing.
Hi Dr. Frederick, thank you very much for taking a look and offering some suggestions!
It’s roughly 5min long. Yes, I think for a few subjects the % fits mildly increased, but that’s it. Shall leave it in
I tried looking at this in tide pool, but couldn’t make out a clear trend for the voxels with widths > 5s. My maps are super speckly.
So I tried the following:
I took the maxwidth_map and thresholded it to create one containing voxels with widths < 5s, and another with voxel-widths > 5s.
I then multiplied each of these against the corrfit_mask to restrict to “valid fits”.
Finally, I called histnifti and plotted the the correlation distribution using maxwidth_map. Masking first with valid_width_mask < 5s, and then with valid_width_mask > 5s.
I was expecting the voxels with widths > 5s to have a maxcorr distribution skewed to the left. Instead, they were skewed to the right.
When I changed the search range to -5:40, with simcalc focused on 60s+, and a motion file passed in: there was some general improvement, but subjects 5 and 10 remained weird.
Now I get that this isn’t the same as what the correlation function gets at. When looking at the function in tide pool, sometimes the function curve was sharp/steep. Sometimes, it was a broad/multi-peaked plateau. I don’t know if there’s a way to get some sort of summary of correlation-function shape/using the corrout file? And if that will clarify anything.
(On the side: Earlier I prepared a little compilation of the sLFO amplitude (RMS) vs time for each subject. Does anything here look strange/jump out? )
Sure - message me. I think looking directly at your maps might be helpful.
Your plots of RMS sLFO amplitude don’t look particularly weird - but that’s an experimental metric so it may not tell you that much. The fact that the motion filtering doesn’t change it a lot is reassuring - it shouldn’t, other than maybe making the average value just a little bit higher by reducing noise.