Summary of what happened:
Hi all, I am very new to fmri analysis. So I apologise in advance if any of my question sounds silly.
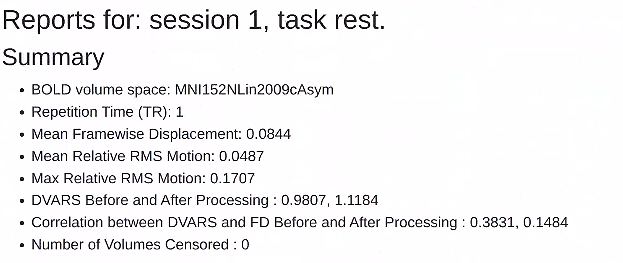
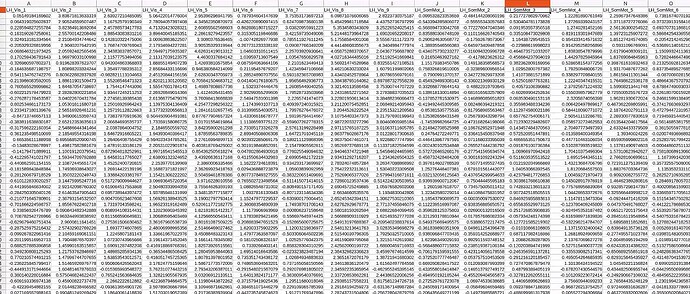
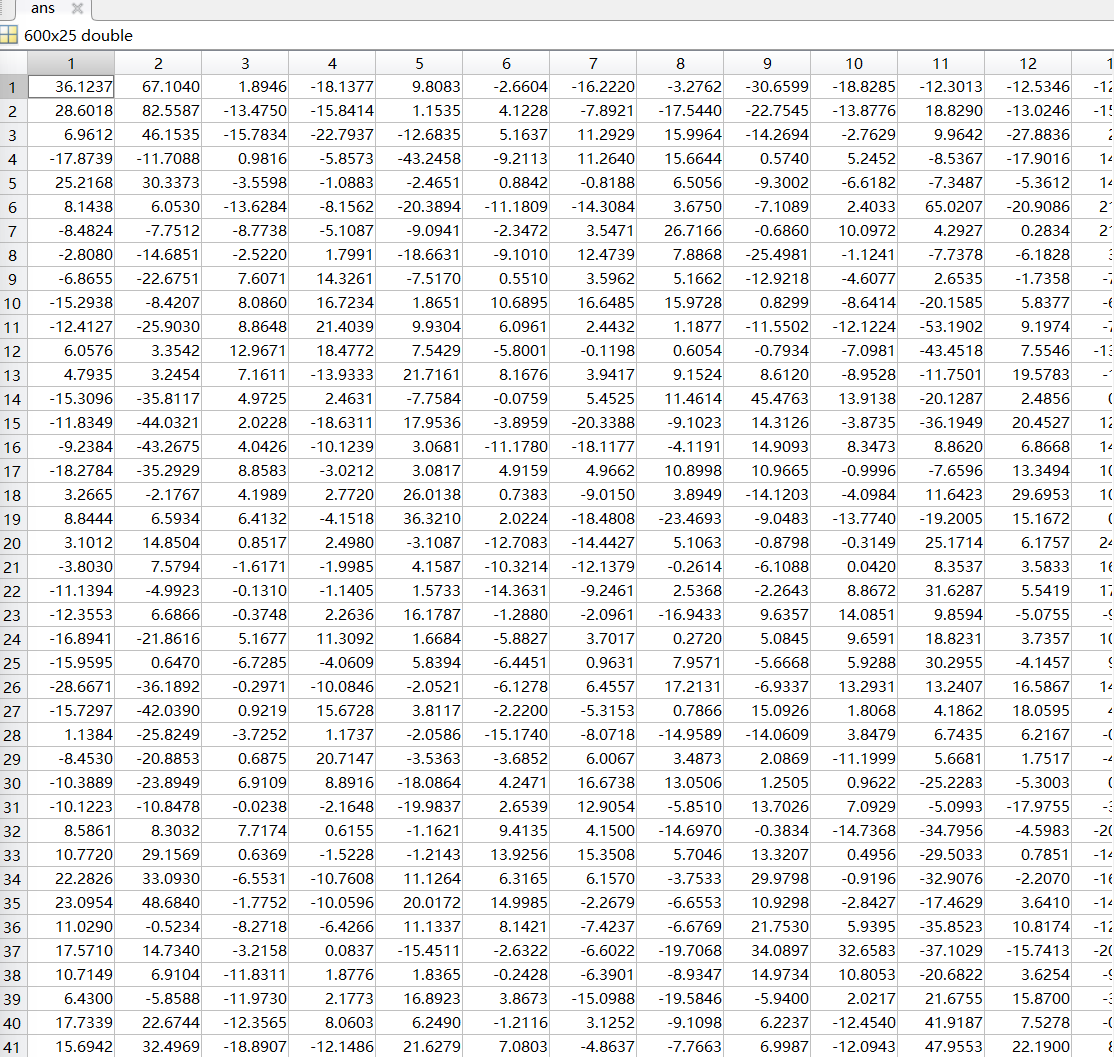
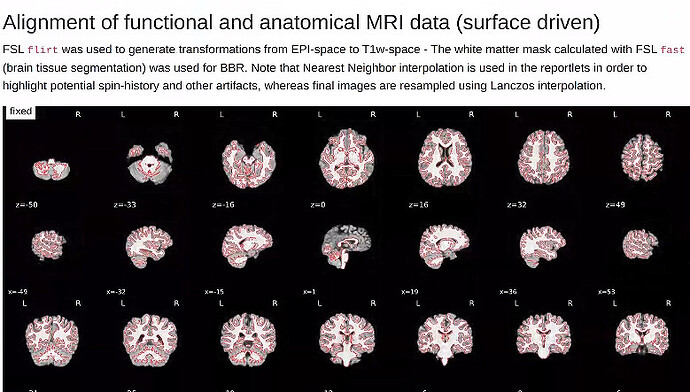
I would like to analyse rs-fmri using Hidden Markov Model, so I used fmirprep + XCP-D pipeline to process my resting fmri data. The desired input for my follow on HMM analysis is parcellated time series. Although I have run everything successfully, but to check I didn’t accidentally screw something up, I compared my parcellated time series with another one of the references that has opened their code and data. I found out the value in my parcellated time series is quite small compared to their parcellated time series input (often ranges from -100 to +100), does that mean I made some error somewhere? I have attached the screenshot of the fmriprep, XCP-D, and parcellated time series. Does this make sense to you?
In addition, what would you normally look for in the qc file to ensure the processing does a good job?
Command used (and if a helper script was used, a link to the helper script or the command generated):
fmriprep code
fmriprep-docker ${PROJECT_DIR}/Nifti ${PROJECT_DIR}/fmriprep-deriv \
 --participant-label 101 \
 --fs-license-file ${PROJECT_DIR}/license.txt \
 --fs-no-reconall
 --stop-on-first-crash
XCP-D code
docker run -it \
 -v ${PROJECT_DIR}/fmriprep-deriv:/fmriprep:ro \
 -v  ${PROJECT_DIR}/tmp:/work:rw \
 -v  ${PROJECT_DIR}/XCP-D-output \
pennlinc/xcp_d:latest \
/fmriprep \
/out \
participant \
--mode linc \
--participant-label 101 \
--input-type fmriprep \
--file-format nifti \
--smoothing 6 \
--despike y \
-p 36P \
--lower-bpf 0.01 \
--upper-bpf 0.15 \
--atlases 4S156Parcels
Environment (Docker)
Screenshots / relevant information:
Rest fmri parcellated time series (My data):
Reference parcellated time series from published paper, a larger parcellation ROI:
Report from XCP-D: (Happy to provide more if this is needed)

Report from fmriprep: (Happy to provide more if this is needed)
Thank you in advance for the help!
Kind regards
Eric


