I would like to use NiMARE to create the same association map that one would get when following this neurosynth link and then manually downloading the association map. I was able to implement the following code, which seems to go in the right direction, but it seems that neurosynth.org does one more additional step (cluster-thresholding perhaps?) which leads to a positive-only + thresholded map. How do I have to adapt my script to reproduce this statistical map?
Here’s my code:
import nimare
from utils import get_nimare_dataset
from nilearn.plotting import plot_stat_map

###############################################################################
## Analysis settings ###########################´###############################
###############################################################################

# set term of interest
term = 'terms_abstract_tfidf__cognitive control'

# this just gets everything behind the two underscores (for plotting)
term_name = term.split("__")[1]

# get neurosynth data
databases = nimare.extract.fetch_neurosynth(data_dir='../data')[0]

# convert to NiMARE dataset (can take a while so we cache)
ds = nimare.io.convert_neurosynth_to_dataset(
    coordinates_file=databases['coordinates'],
    metadata_file=databases['metadata'],
    annotations_files=databases['features']
    )

# get all studies that are associated with the term
term_ids = ds.get_studies_by_label(labels=term,label_threshold=0.001)

# now get all studies that do NOT include this term
all_ids = ds.ids
notterm_ids = sorted(list(set(all_ids) - set(term_ids)))
term_dset = ds.slice(term_ids)
notterm_dset = ds.slice(notterm_ids)

# Run the meta-analysis.
# No multiple comparisons correction since you want the unthreshold maps.
meta = nimare.meta.cbma.mkda.MKDAChi2()
results = meta.fit(term_dset, notterm_dset)
results.save_maps(output_dir="../data/neurosynth_results", prefix=term_name)

# correct for multiple comparisons
corrector = nimare.correct.FDRCorrector(alpha=0.01)
results_corrected = corrector.transform(results)
results_corrected.save_maps(output_dir="../data/neurosynth_results", prefix=term_name)

# plot stat map before multiple comparisons
plot_stat_map(stat_map_img='../data/neurosynth_results/cognitive control_z_desc-specificity.nii.gz',
             cut_coords=(0,0,0))

# plot stat map after multiple comparisons
plot_stat_map(stat_map_img='../data/neurosynth_results/cognitive control_z_desc-specificity_level-voxel_corr-FDR_method-indep.nii.gz',
              cut_coords=(0,0,0))

# plot manually downloaded stat map from neurosynth. Make sure to download
# this first by following this link (https://neurosynth.org/analyses/terms/cognitive%20control/)
# and downloading the association map into the same folder as the other maps
plot_stat_map(stat_map_img='../data/neurosynth_results/cognitive control_association-test_z_FDR_0.01.nii.gz',
              cut_coords=(0,0,0))
Here’s how the statistical maps look like:
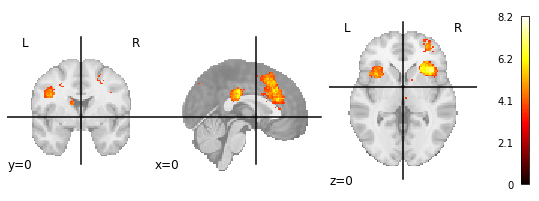
1.) NiMARE (without FDR-correction)

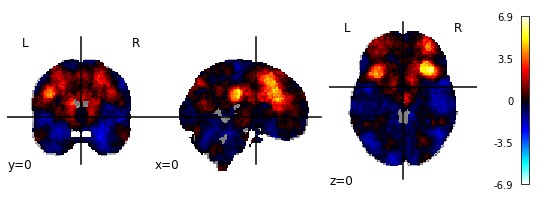
2.) NiMARE (with FDR-correction)
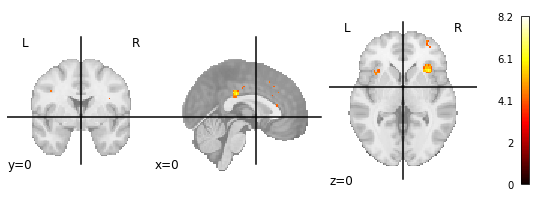
3.) Manually downloaded map from neurosynth.org for the term ‘cognitive control’
P.S.: In the neurosynth FAQ it says:
The images you see are thresholded to correct for multiple comparisons. We use a false discovery rate (FDR) criterion of .01, meaning that, in theory, and on average, you can expect about 1% of the voxels you see activated in any given map to be false positives (though the actual proportion will vary and is impossible to determine).
But why does the maximum value of 8.2 of the neurosynth-image then matches with the uncorrected image and not the corrected one?