I am currently running a region of interest (ROI) RSA on the concatenated fMRI data and I am facing a weird pattern of activations. The general same structure of activations is present across all ROIs and weirdly enough is present also in cerebro-spinal fluid (CSF) and white matter. I haven’t still tested the differences between the regions and I am sure that there will be differences. However, is it common to have the same general pattern of activations even in the regions which theoretically should not show any specific patterns (the white matter and the CSF in my case)? Did anyone experience the same lack of region specificities?
That sounds weird. Would you mind describing your problem in more detail? If I understand it correctly, you are finding very similar RDMs in lots of different brain regions? In general, this is not unusual when using data from within runs, although the pattern should obviously not be meaningful. Did you create your RDMs on data of the same runs or calculate (dis)similarities between runs? (the latter can help avoid problems due to autocorrelation within runs). How large are your RDMs, are they based on single trial betas? How did you calculate your betas? All of this can help figure out an answer to your problem. But in general, I would first have a look at the data before they enter the RDM stage (i.e. the data matrices that you use for calculating (dis)similarities). If you find large differences between conditions everywhere, this might also speak to confounds (e.g. head motion / respiration).
Agreed, this does not sound normal, but rather suggests a bug. You mention running a ROI-based RSA, but your question about seeing “activations” (to be picky, RSA results aren’t exactly “activations” but similarity patterns) in CSF and white matter makes me wonder if you did a searchlight analysis. Or is this a large “CSF” ROI?
I double Martin.
also it might be that you are picking up on consistent noise in your RDMs. That could only occur if your design is quite unbalanced. also if you smooth a lot, you might get some “structure” in WM/CSF due to smearing.
thank you for your reply! Indeed, the thing I got suspicious about is how similar the RDMs look like across several regions (e.g., ACC, IFG, Dorsal Striatum, Pallidum). Now I am not sure whether I should be worried about the general visual similarities across all regions (when I inspect the RDMs) or I should just do not pay attention and trust my stats that do show some differences between regions (of course, not for all comparisons and not for all regions). But again, even though the stats show some significant dissimilarities, I still have this white matter and CSF RDMs that visually look like the ROIs’ RDMs.
I created the RDMs on concatenated runs. Or what do you mean by the data of the same runs?
My RDMs are quite large: 23x23 (there are a lot of conditions in my experiment). Moreover, my fMRI design is mixed block/event-related one, so I have both single trial betas and block betas. My betas were calculated from the first-level analysis on the concatenated data (non-smoothed data, realigned and normalized data).
We also collected simultaneous EEG data, so there is more movement that it would be in a single fMRI experiment, however, we tried to clean the fMRI data from the movement artifacts as much as we could.
yes, we also got some feedback that this can happen when the design is unbalanced, however, it is not the case… we have the same number of trials per condition. And we did not smooth the data…
it is a bit hard to tell without seeing figures. But can you send me (us?) a second-order MDS of all your single-subject RDMs from say two functional ROIs and the CSF ROI? give each ROI and the CSF different colors and if they are all similar we’d expect to see a mixture of colors there (normally you expect somewhat clustering for the functional ROIs but large variance for CSF).
Ok, and are you saying all conditions are balanced within each run? Else you might have confounded “run” with “condition”. Also, I’m not sure what the effect of mixing block and event-related betas is (block betas will be less variable and closer to the true value, whereas event-related will be more variable). And the fact that with simultaneous EEG you have lots of noise that is possibly correlated across wide parts of the brain can make things a little awkward.
You can also run cross-validated RSA, e.g. using the linear discriminant contrast. Alternatively, you could only correlate ROIs between runs (e.g. odd vs. even). This should at least reduce the effect of idiosyncratic effects that are specific to runs. I think this is probably my best bet in getting rid of spurious effects. Related papers are this, this, this, and this.
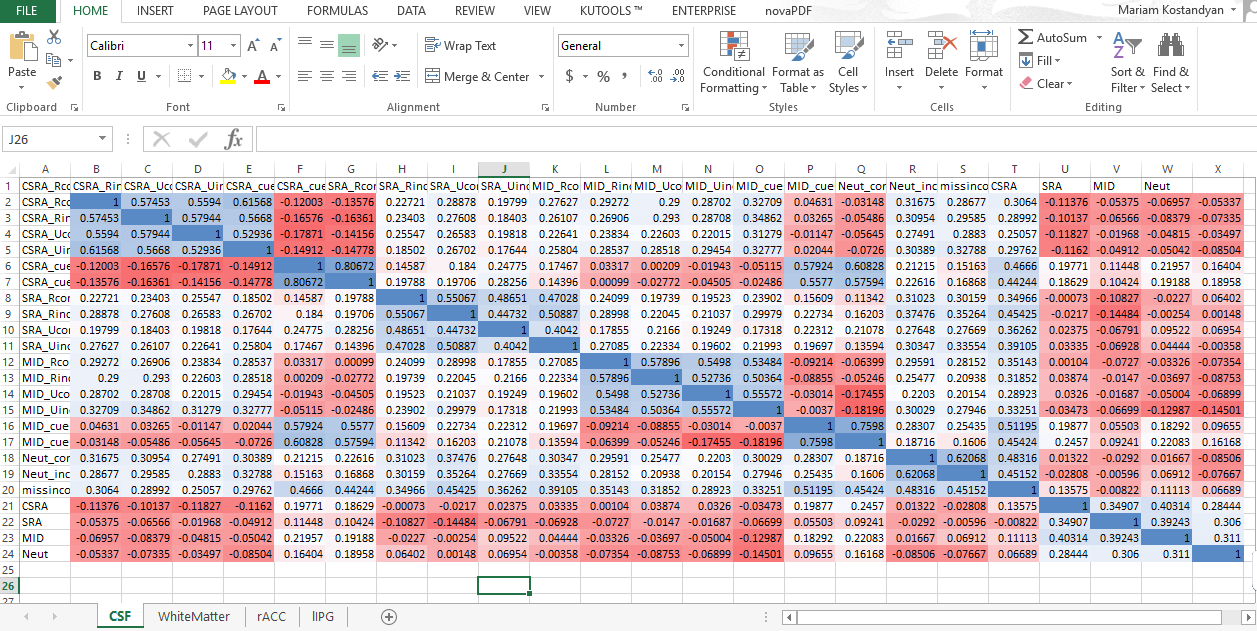
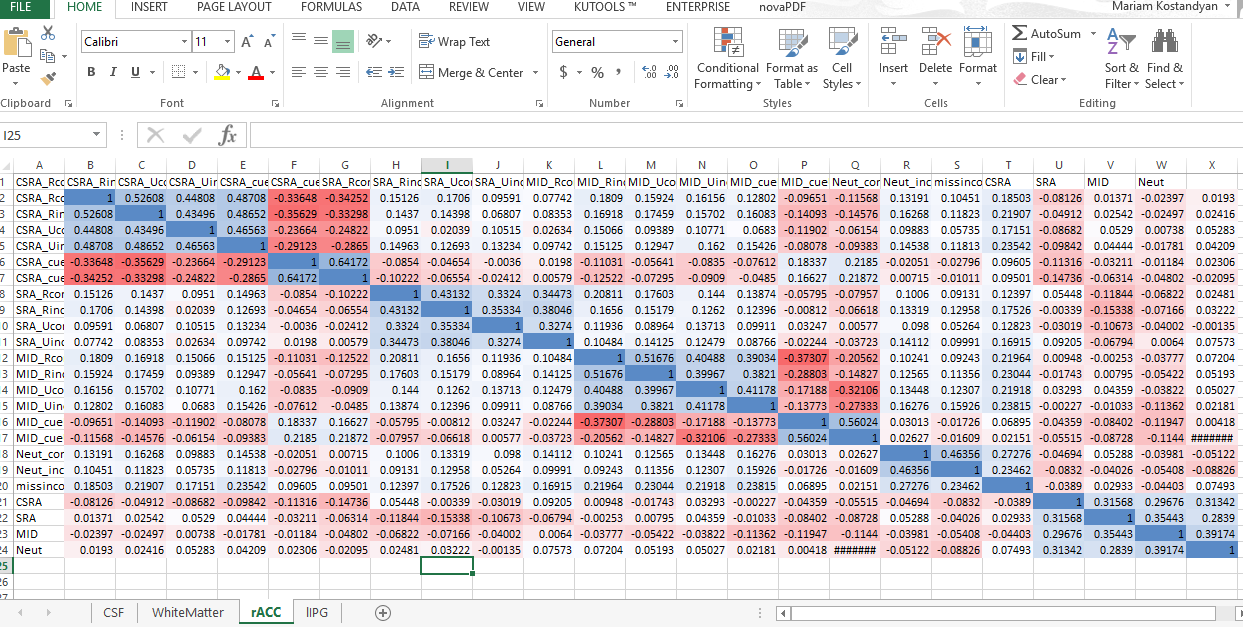
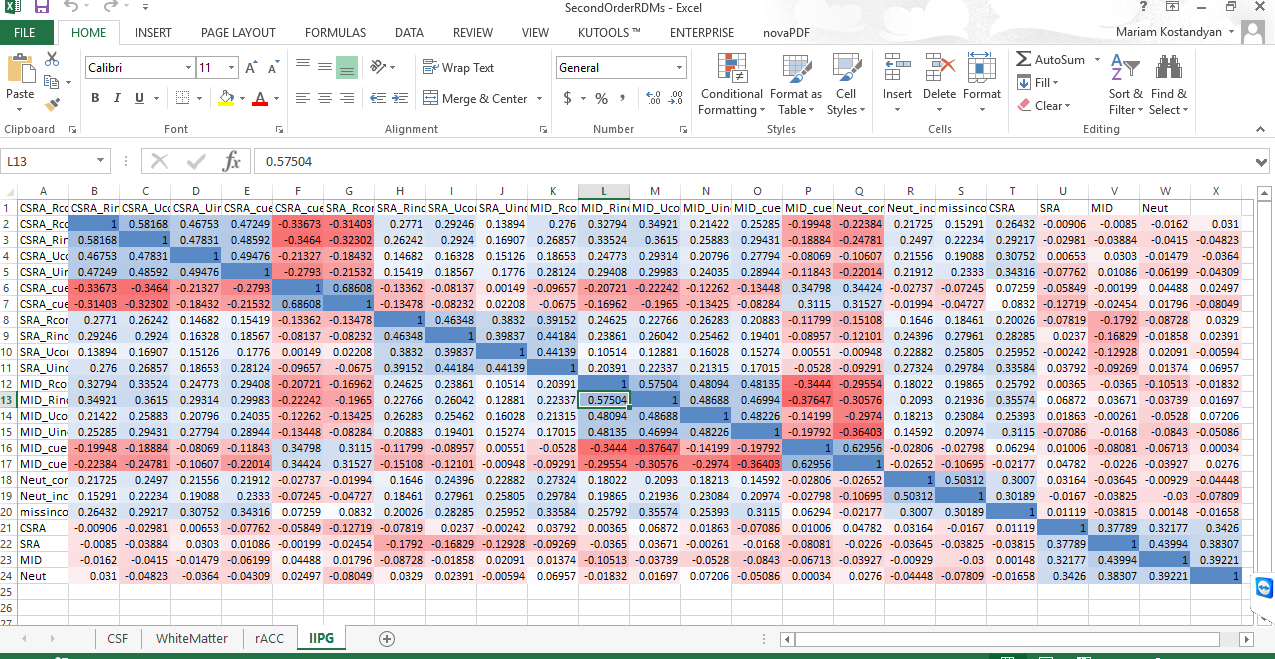
thank you for your reply. I am attaching the an excel file with CSF, white matter, cingulum, and inferioir parietal gyrus ROIs (in the following order). I didn’t finish the .mat script for plotting RDMs, so I am using excel for now.
I’m not sure but this looks like a conditioning paradigm. That means your patterns may be confounded with the effect of time. In other words, your regressors may overlap systematically and are correlated (depending on the shape of the HRF positive correlation for SOA < 4.5s, negative correlation for SOA > 4.5s, and then again positive correlation after around 12s). Correlated regressors lead to correlated betas independent of what is the signal, so you may find the same pattern of correlations everywhere. I hope this makes sense. The easiest solution to this problem is to calculate similarities only between separate runs and never within run. If you depend on within-run analyses, then you can try the Bayesian RSA approach discussed in the above references.
Are these the group-averaged RDMs?
If yes, it doesn’t help that much in the diagnosis. It’d be more informative to look at the second order RDM correlation matrix for these ROIs and all subjects (you can use rsa.pairwiseCorrelateRDMs from the rsa toolbox).
However, generally it is recommended to use cross-validated distance measures (e.g. crossnobis). For that you can use rsa.distanceLDC in the toolbox. If you have severe timing biases, another way to what @Martin was suggesting is to regress out the nuisance effects using a model RDM.