Second-level group comparison in Nilearn

Hi there,

I’m trying to run a second-level group comparison using Nilearn for a task-based fMRI paradigm. At the first level, I specified two contrasts for each subject: Stim1 > Stim2 and Stim2 > Stim1. Now, I want to compare these contrasts across three groups.

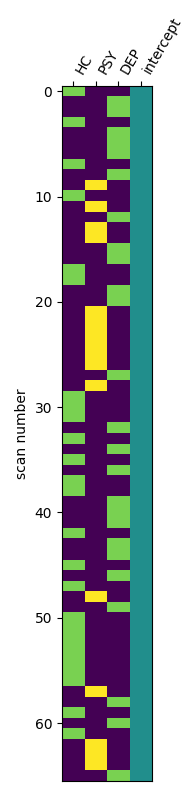
For the second-level GLM, I included dummy-coded group variables along with an intercept. To compare group A vs. group B, I set the contrast to [1, -1, 0, 0]. I also examined the main effect by dropping the group variables and using only the intercept. Additionally, for exploratory purposes, I looked at the effect of individual groups, e.g., using the contrast [1, 0, 0, 0] for group A.

However, I’m getting identical results for all group comparisons, which doesn’t seem correct. I suspect that the intercept might be coded differently than I expect, possibly affecting how the contrasts are interpreted. I would appreciate any advice on what might be going wrong or how to properly set up the contrasts.

Many thanks in advance!
Annkathrin

do you have a bit of code we can look at?
mostly about how you set up the group level GLM

Thanks for the reply! Sure, here is the code to I use:

pp_order = [re.search(r'Z_map_(p\d+)\.nii\.gz', path).group(1) for path in first_level_maps]
pp_group = pp_group[pp_group["ID"].isin(pp_order)]
design_matrix = pd.DataFrame(
    [[1 if label == group else 0 for group in group_names] for label in pp_group['Group']], 
    columns=['HC', 'PSY', 'DEP'])
design_matrix['intercept'] = 1

When I look at the main effect I use:

design_matrix_main_effect = design_matrix.drop(['HC', 'PSY', 'DEP'], axis = 1)
second_level_model = second_level_model.fit(first_level_maps, design_matrix=design_matrix_main_effect) 
z_map_second_level = second_level_model.compute_contrast('intercept', output_type='z_score')

For the contrast, I use these weights:

group_comparisons = {'HC': [1, 0, 0, 0],
                     'PSY': [0, 1, 0, 0],
                     'DEP': [0, 0, 1, 0],
                     'HC_vs_PSY': [1, -1, 0, 0],
                     'HC_vs_DEP' : [1, 0, -1, 0],
                     'DEP_vs_PSY': [0, -1, 1, 0],
    }

second_level_model = second_level_model.fit(first_level_maps, design_matrix=design_matrix)
z_map = second_level_model.compute_contrast(group_weights, output_type='z_score')

just to check what does you resulting design matrix look like?

The design matrix for the group comparisons looks like this:

The rows correspond to the first level results of each subject and not the scans.

something seems off
I would expect the design matrix to contain only 1s and 0s but your design matrix has more than 2 colors.
is this normal?

You’re right, that’s weird. I also save my design matrix as a .csv as a QC. This only contains 0s and 1s. Do you know what could lead to the variation in the colors?

I realized this is just because of the visualization of the design matrix, as I did not set ‘rescale’ to fasle. If I do so, I only have two colors in the plot of my design matrix.

I am still wondering if and how I need to include the intercept in my GLMs.

1 Like