SecondLevelModel/non_parametric_inference/permuted_ols after searchlight.scores_

Hello,

I want to do statistical test for my searchlight results, and I found it seems that the SecondLevelModel/non_parametric_inference/permuted_ols functions are similar.
Firstly I did a one-sample test by a second-level fMRI model.
Here is the mean image of the searchlight.scores_ across participants (chance level = .25):

group_mean

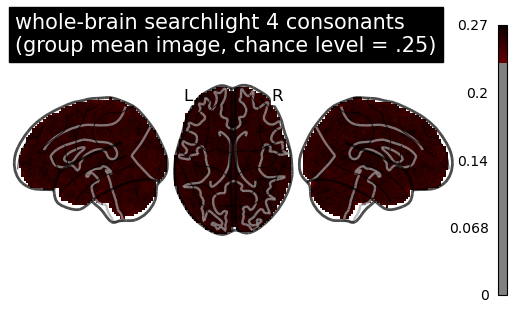
and here is the result using SecondLevelModel for a one-sample test:

test

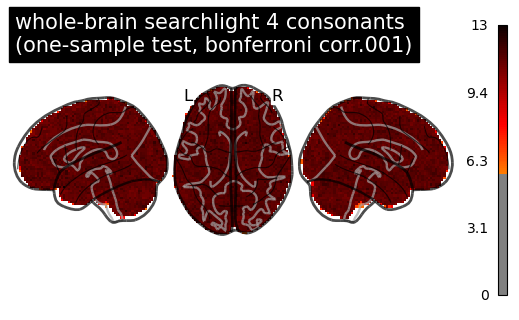
then I computed a corrected p-values with a permutation test following the example by non_parametric_inference(), and the argument design_matrix is the same one as I used in SecondLevelModel, so intrcept = 0.25.

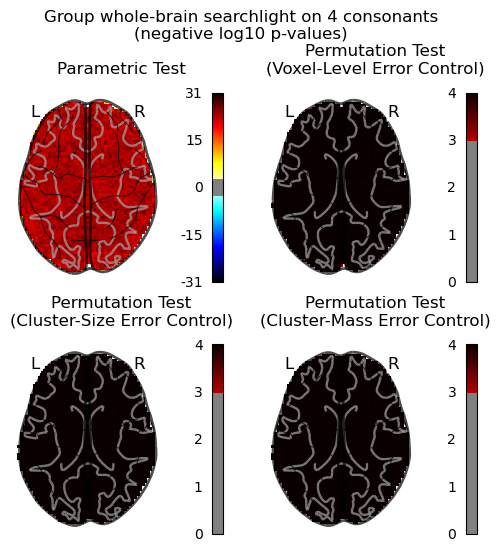
I think something is obviously off here. For the glass brain “Voxel-Level Error Control” I set the threshold=None as mentioned in the example for running the voxel-level correction.

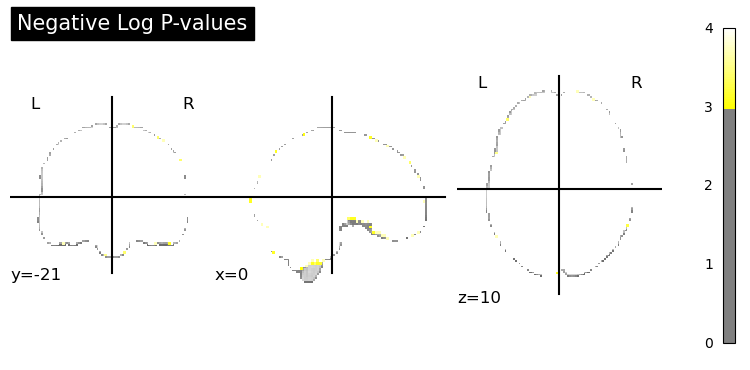
Instead, if I just threshold the result of one-sample test, I can at least see the voxels with the highest classification score.

Question:

  1. Am I right to do the one-sample test with the permutation test here?
  2. The input images here is different from the example that they are an array of classification accuracy score, so did I miss something here?
  3. I also take a look of another example of massively univariate analysis, but I don’t understand how to do this with the searchlight results in which we don’t have labels anymore.

Can you share the code for the parametric test ? I have the impression that you may not be testing against the chance level (0.25).
If used properly, the non-parametric test should be more reliable than the parametric test.
Best,
Bertrand

Hello Bertrand,
Sure, here is my script, and I define the chance level in the design_matrix:

## load searchlight result images
imgs = []
for i, subject in enumerate(sub_list):
    img_sub = nib.load(os.path.join(searchlight_path, f'pp-con-results/{subject}_searchlight.nii.gz'))
    imgs.append(img_sub)

## define design_matrix with the intercept at chance level = 0.25
second_level_input = imgs
design_matrix = pd.DataFrame(
    [0.25] * len(second_level_input),
    columns=["chance_level"],
)

## SecondLevelModel for one-sample test and z-map output
onesample_ttest = SecondLevelModel().fit(
    second_level_input,
    design_matrix=design_matrix,
)
z_map = onesample_ttest.compute_contrast(
    second_level_contrast="chance_level",
    output_type="z_score",
)

## compute a p-value corrected parametric test
p_val = onesample_ttest.compute_contrast(output_type="p_value")
n_voxels = np.sum(get_data(onesample_ttest.masker_.mask_img_))
# Correcting the p-values for multiple testing and taking negative logarithm
neg_log_pval = math_img(
    f"-np.log10(np.minimum(1, img * {str(n_voxels)}))",
    img=p_val,
)

##  non parametric permutation test
out_dict = non_parametric_inference(
    second_level_input,
    design_matrix=design_matrix,
    model_intercept=True,
    n_perm=10000,
    two_sided_test=False,
    n_jobs=-1,
    threshold=0.001,
)
## Voxel-Level Error Control with the default threshol = None
out_dict_voxel = non_parametric_inference(
    second_level_input,
    design_matrix=design_matrix,
    model_intercept=True,
    n_perm=10000,
    two_sided_test=False,
    n_jobs=-1,
)

## visualization
threshold = 3.0  # For p < 0.001, approximately -log10(0.001) = 3.0
cut_coords = [0]

IMAGES = [
    neg_log_pval,
    out_dict_voxel,
    out_dict["logp_max_size"],
    out_dict["logp_max_mass"],
]
TITLES = [
    "Parametric Test",
    "Permutation Test\n(Voxel-Level Error Control)",
    "Permutation Test\n(Cluster-Size Error Control)",
    "Permutation Test\n(Cluster-Mass Error Control)",
]

fig, axes = plt.subplots(figsize=(6, 6), nrows=2, ncols=2)
for img_counter, (i_row, j_col) in enumerate(
    itertools.product(range(2), range(2))
):
    ax = axes[i_row, j_col]
    plotting.plot_glass_brain(
        IMAGES[img_counter],
        colorbar=True,
        display_mode="z",
        plot_abs=False,
        cut_coords=cut_coords,
        threshold=threshold,
        figure=fig,
        axes=ax,
    )
    ax.set_title(TITLES[img_counter])
fig.suptitle("Group whole-brain searchlight on 4 consonants\n(negative log10 p-values)", y = 1)
plt.show()

I also tried the permutation test with permuted_ols for another condition (chance level = 0.5), and I got the same strange result. Does it mean there might be some problems with my result images from nilearn.decoding.SearchLight?
But still, it seems I could get the “meaningful” voxels from high thresholded one-sample t-test image (the last png of the first post above).

imgs = []
for subject in sub_list:
    img_path = os.path.join(searchlight_path, f'pp-lang-results/{subject}_searchlight.nii.gz')
    img_sub = nib.load(img_path)
    imgs.append(img_sub)

design_matrix = pd.DataFrame(
    [0.5] * len(imgs),
    columns=["chance_level"]
)
design_matrix_np = design_matrix.values

nifti_masker = NiftiMasker(
    standardize=False, smoothing_fwhm=None, memory="nilearn_cache"
)
masked_img = nifti_masker.fit_transform(imgs)

# Perform the permutation test
neg_log_pvals, t_scores_original_data, _ = permuted_ols(
    design_matrix_np,
    masked_img,
    model_intercept=False,
    n_perm=10000,
    two_sided_test=False,
    n_jobs=-1
)

signed_neg_log_pvals = neg_log_pvals * np.sign(t_scores_original_data)
signed_neg_log_pvals_unmasked = nifti_masker.inverse_transform(signed_neg_log_pvals)

# Plot the negative log p-values image
plotting.plot_stat_map(
    signed_neg_log_pvals_unmasked,
    title='Negative Log P-values',
    display_mode='ortho',
    threshold=3.0,
    colorbar=True,
    cmap='cold_hot'
)
plotting.show()