Separate cifti by structure in python

I would like to do things with the cifti beta maps in HCP using python.
But first I want to make sure that I know where I am in the brain, that is, how do the grayordinates map onto different structures.

Tl;dr: How do I subset the grayordinates so that I have the left and right hemisphere vertices in python?

Let’s say I just want to view the left hemisphere beta map overlaid onto the group average mesh. I have confirmed that they are both 32k_fs_LR mesh.

beta map

tfMRI_GAMBLING_hp200_s2_level2_MSMAll.feat/GrayordinatesStats/cope1.feat/pe1.dtseries.nii

mesh:

S1200.L.inflated_MSMAll.32k_fs_LR.surf.gii

Using an example derived from the nibabel cifit examples, I am doing the following:

import numpy as np
import nibabel as nib
from nilearn import plotting

# load image
img = nib.cifti2.load('pe1.dtseries.nii')
# get brain model for left cortex
bml = [f for f in img.header.matrix.get_index_map(1).brain_models if f.brain_structure == 'CIFTI_STRUCTURE_CORTEX_LEFT']
# get image offset (not really relevant for left cortex, but will be for right)
index_offset = bml[0].index_offset
# get left hemi vertex indices
vertexIndicesInDataLeft   = [i+index_offset for i in bml[0].vertex_indices]
# count the number of vertices
len(vertexIndicesInDataLeft)
    29696 # why is this not 32492?

# get the beta values
beta_map = img.get_fdata()
# subset left vertices
left_map = beta_map[0,vertexIndicesInDataLeft]
# create zero pad to expand to 32k
map_full = np.zeros((1,32492))
# put beta values onto full map
map_full[0,vertexIndicesInDataLeft] = left_map 

# load mesh
mesh = nib.load('S1200.L.inflated_MSMAll.32k_fs_LR.surf.gii')
# plot
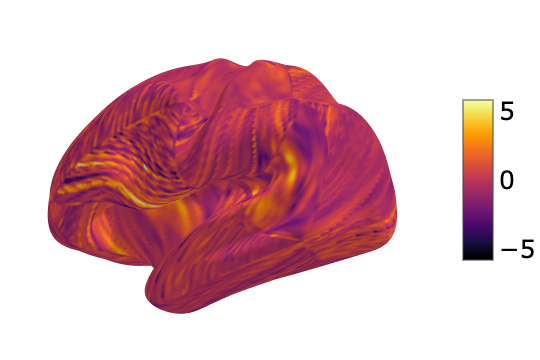
plotting.view_surf(mesh.agg_data(), map_full, symmetric_cmap=False, cmap='inferno')

The above code gives me a trippy brain. I suspect it has something to do with how I’m indexing the left hemi’s vertices.
newplot (7)

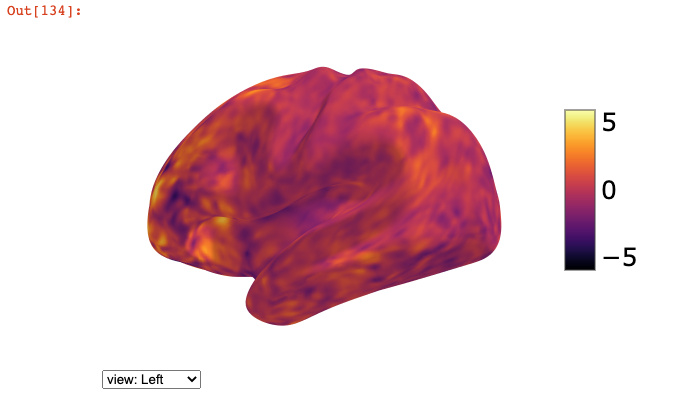
If I use the connectome workbench to separate the cifti into a left hemi gifti, it works fine.

wb_command -cifti-separate pe1.dtseries.nii COLUMN -metric CORTEX_LEFT pe1.L.32k_fs_LR.func.gii

then

mesh = nib.load('S1200.L.inflated_MSMAll.32k_fs_LR.surf.gii')
beta_map = nib.load('pe1.L.32k_fs_LR.func.gii').agg_data()
plotting.view_surf(mesh.agg_data(), beta_map, symmetric_cmap=False, cmap='inferno')

Screen Shot 2020-10-28 at 3.39.47 PM

.@effigies had a great presentation at NeuroHackademy this year that included a section on handling CIFTIs with spatial awareness in nibabel 3.x. You can find his notebook here.

In particular, I think this code segment might be useful:

import nibabel as nb
from nilearn import plotting as nlp

def surf_data_from_cifti(data, axis, surf_name):
    assert isinstance(axis, nb.cifti2.BrainModelAxis)
    for name, data_indices, model in axis.iter_structures():  # Iterates over volumetric and surface structures
        if name == surf_name:                                 # Just looking for a surface
            data = data.T[data_indices]                       # Assume brainmodels axis is last, move it to front
            vtx_indices = model.vertex                        # Generally 1-N, except medial wall vertices
            surf_data = np.zeros((vtx_indices.max() + 1,) + data.shape[1:], dtype=data.dtype)
            surf_data[vtx_indices] = data
            return surf_data
    raise ValueError(f"No structure named {surf_name}")

_ = nlp.plot_surf(str(data_dir / "conte69/Conte69.L.inflated.32k_fs_LR.surf.gii"),
                  surf_data_from_cifti(cifti_data, axes[1], 'CIFTI_STRUCTURE_CORTEX_LEFT').mean(axis=1),
                  cmap='plasma')

Hope that helps !

Elizabeth

2 Likes

Thanks @emdupre!

Indeed, the above code does work for me.
Though I’m confused why. From my understanding of the CIFTI-2 header it seems like my code should be doing the same thing (albeit in a more roundabout way). @effigies if you get the chance, could you look over my original post and point out where I made the mistake?

Can someone clarify what the “axes” variable is? I don’t see this key value in my cifti file and I’m a little confused on what it’s supposed to be.

For reference, I’m trying to plot pdconn cifti data on a surface using the following code that uses the function writtenn by emdupre:

sub_cii = nib.load(sub_data_path + out_file + ".pdconn.nii")
mesh = nib.load('S1200.L.inflated_MSMAll.32k_fs_LR.surf.gii")
display = plotting.plot_surf(mesh.agg_data(), surf_data_from_cifti(sub_cii, axes[1], 'CIFTI_STRUCTURE_CORTEX_LEFT').mean(axis=1),cmap='plasma')
display.savefig(out_file + ".pdconn.png")     
display.close()

This is from the notebook Elizabeth linked.

axes = [cifti_hdr.get_axis(i) for i in range(cifti.ndim)]
2 Likes

I know this is from a while ago, but conceptual question here: when plotting the intensities from the cifti data on the surface as in @effigies’s code above, is this just looking at one timepoint? How do you look at other points in the timeseries?

Here the .mean(axis=1) is taking the mean, across time, at each coordinate. You could just as easily do surf_data_from_cifti(cifti_data, axes[1], 'CIFTI_STRUCTURE_CORTEX_LEFT')[time_pt_index].

1 Like

I assume @bwinsto2 question was how to slice over output of surf_data_from_cifti. To take time_pt_index it should be written as surf_data_from_cifti(cifti_data, axes[1], 'CIFTI_STRUCTURE_CORTEX_LEFT')[:time_pt_index] actually, as for 0 dimension you should take all brain_models array