Hi all,
I have a question. From DTI we get 3 eigen values and 3 eigen vectors for each voxel. With the help of three eigen values we calculate FA (Fractional anisotropy). What is the significance of product between eigen vector and FA?
Hi all,
I have a question. From DTI we get 3 eigen values and 3 eigen vectors for each voxel. With the help of three eigen values we calculate FA (Fractional anisotropy). What is the significance of product between eigen vector and FA?
The diffusion tensor has a geometric correspondence to the family of spheroids in 3D: a sphere is a particular case, as is a “pointier” set of ellipsoids like a rugby ball (called being “prolate”), and a “flatter” set like a dosa/pancake/flying saucer (called being “oblate”). This correspondence is exact, with the mathematical assumptions of a diffusion tensor. The eigenvectors are the 3 major axes (mutually perpendicular) of the shape; they tell you how the shape is oriented in space (for the sphere, this is a bit meaningless, since it is isotropic, but for, say, a prolate shape this becomes more interesting).
Each eigenvector has an associated eigenvalue, which gives information about the length of along each of these eigenvectors. For a sphere, all eigenvalues are equal; for a rugby ball, the first eigenvector is noticeably bigger than the other 2; for an oblate spheroid, the first 2 eigenvalues are noticeably bigger than the third.
The FA is the normalized standard deviation of the eigenvalues: it tells you how “pointy” or nonspherical a tensor is. FA=0 for a perfect sphere (all eigenvalues are equal, so their standard deviation is 0), and FA=1 as a rugby ball becomes pointier and pointer, to infinity…
In many MRI maps, we are used to visualizing just a single quantity (a scalar): T1w value, a correlation value, a proton density value, etc. These can just be represented by mapping numbers to color, and showing a picture. Fine.
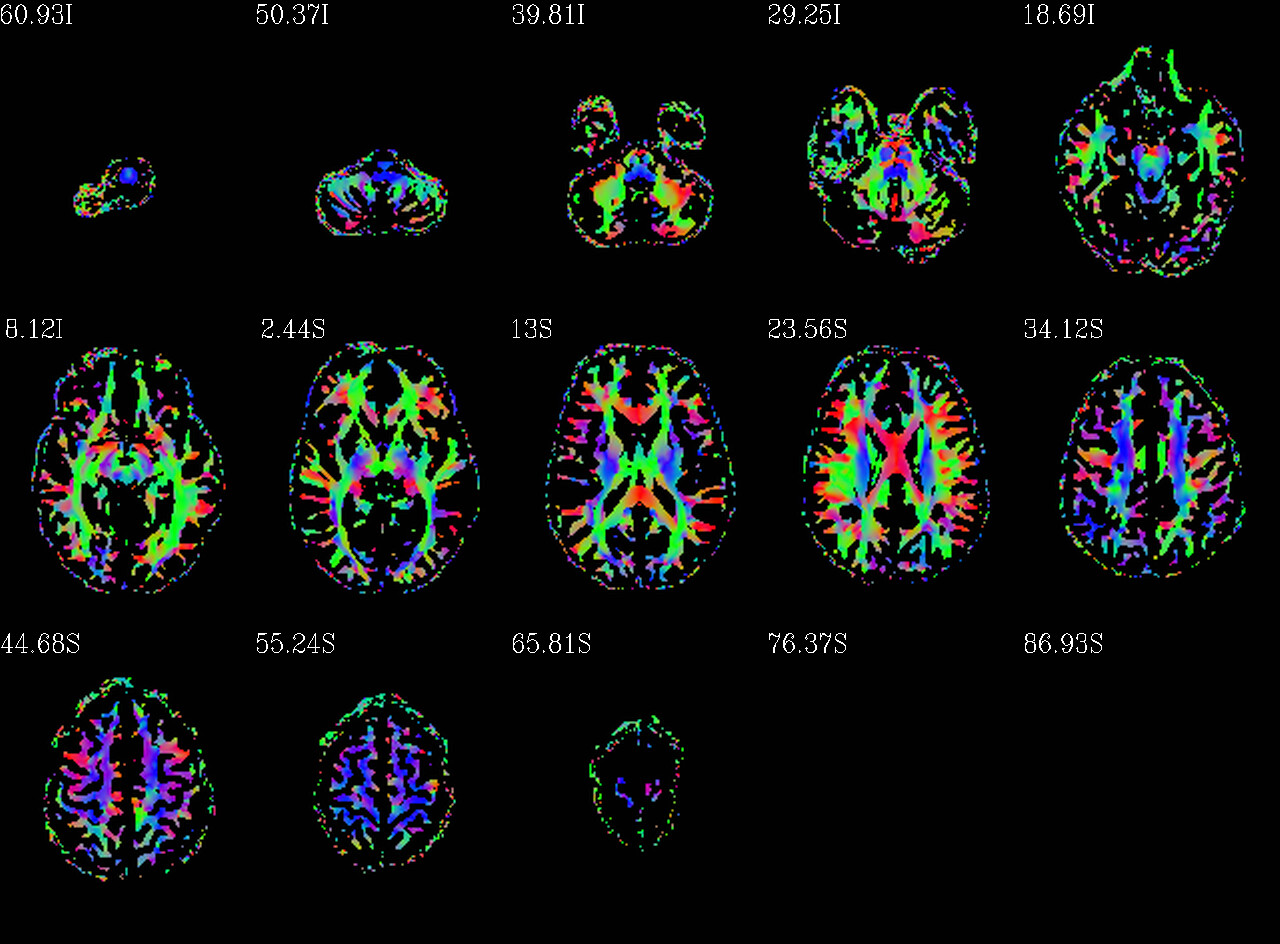
Tensors encode a lot of information, more than just a single number; they encode both direction and magnitude information. How can we visualize such things? Well, we typically associate the first eigenvector (V1) of each tensor (that is, the eigenvector associated with the largest eigenvalue) with possible direction of WM, for prolate tensors. So, this is a direction we care about. To visualize this info, often we use a DEC (directionally encoded color) map, so that a tensor with V1 oriented “left-right” in the coordinate system is red, one that runs “anterior-posterior” is green, and one that is “inferior-superior” is blue. Here is an example of a DEC map montage (axial slices) showing local orientation of a tensor’s V1 wherever we think there might be WM (where FA>0.2):
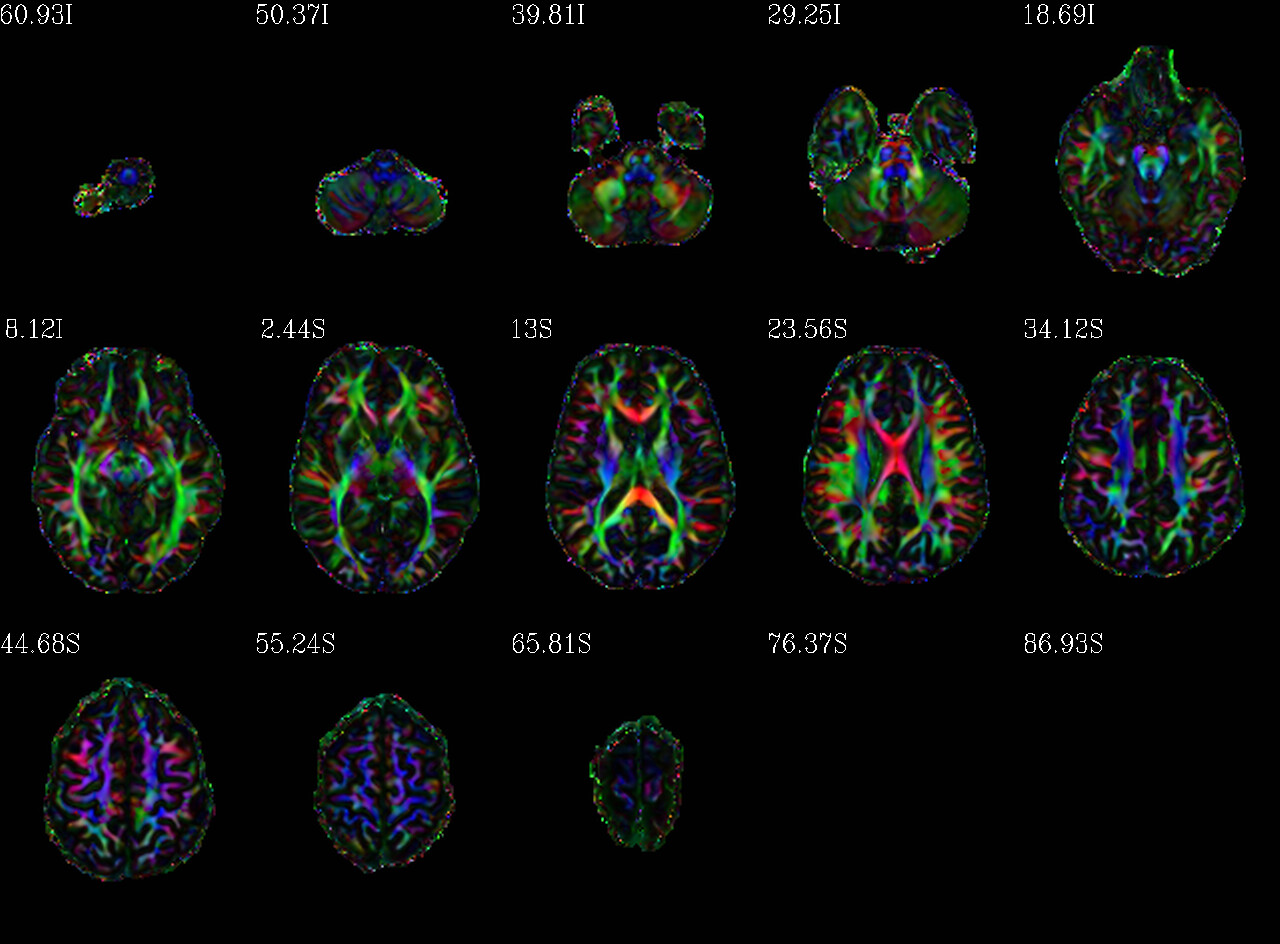
As noted above, we tend to think that tensors with FA>0.2 (in healthy humans >5 yrs old) is most likely associated with WM, so we care about visualizing FA. We can add this information to the DEC map above, by using FA to scale the brightness of the colorful DEC map. Consider the same map from above, but now with RGB coloration modulated by FA for “brightness” (FA>0.7 is full brightness, and brightness decreases linearly with FA value):
For more on DTI quantities, some of these intro lectures might be useful:
https://afni.nimh.nih.gov/pub/dist/doc/htmldoc/educational/bcamp_2017_10_nih.html#supplementary-lectures
–pt
MANAGED BY INCF