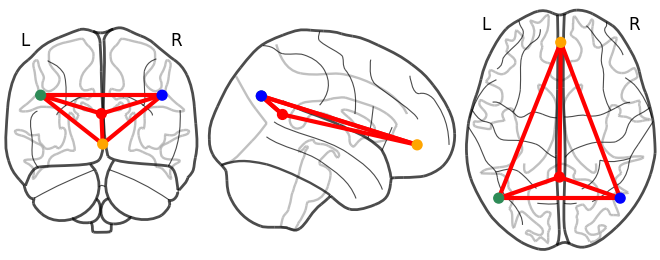
I would like to specify a list of colors for nodes for plot_connectome. I tried to pass a list of color strings like [‘seagreen’, ‘seagreen’, ‘orange’, …, ‘orange’] to node_color, but it was not successful. Function help info says that node color indicates “sequence of colors”. What doex sequence mean here? Does that mean a list of color strings is not acceptable? Thanks.
If I use the hex colors, I am able to use plot_connectome:
import numpy as np
from nilearn import plotting

test_coords = np.array([[-23.81794898, -68.77020797, -40.02397295],
                        [-33.78203359, -69.55754865, -36.85754389],
                        [-25.77646363, -43.73743347, -48.03725606]])
test_colors = ['#e69422', '#87324a', '#778cb0']
test_adj = np.ones((3,3))
plotting.plot_connectome(test_adj, test_coords, test_colors)
you can convert colors to their to hex representation like so:
from matplotlib import colors
colors.to_hex('blue')
Hope that helps!
James
Thanks so much James!
I looked in the script of that function, and figured out a similar solution:
list_dat['Grp_Color'] = np.where(list_dat['Grp']==1, 'seagreen', 'orange')
grp_color_list = []
for grp_color in list_dat['Grp_Color']:
    grp_color_list.append(colors.colorConverter.to_rgba(grp_color))
grp_color_list = np.array(grp_color_list)
This seems to be working well. The idea is similar to your. Thanks.
Xiangzhen
The maptlotlib color module provides useful functions to convert named colors to arrays:
https://matplotlib.org/2.0.2/api/colors_api.html
what versions of nilearn and matplotlib are you using? color names work fine for
me (with nilearn 0.6.0 and matplotlib 3.1.1):
from nilearn import plotting
import numpy as np

coords = [(0, -52, 18), (-46, -68, 32), (46, -68, 32), (1, 50, -5)]
connectome = np.ones((4, 4))
plotting.plot_connectome(
    connectome, coords, node_color=["red", "seagreen", "blue", "orange"],
    output_file="/tmp/connectome_example.png")

and what do you mean by “not successful” ?
Thanks. I double checked this issue. Yes, you are right that a list of color names works well.
I think the problem I had was that node_color does not accept an array variable. I read the color names from a pandas dataframe variable e.g., list_dat[‘Gro_Color’].values. But in this case, this variable is a array variable. When I used list(list_dat[‘Gro_Color’].values), the plotting works well now.
My nilearn version is 0.5.2.
thanks for figuring this out! it is a bug then, the behaviour should be the same for arrays or lists otherwise it is indeed very surprising for users. would you consider opening an issue on the github repo?
I did not test with nilearn 0.6.0. You may have a quick look? Thanks.
If this is still an issue, I can open an issue on the github repo.
yes, with nilearn 0.6 this script:
from nilearn import plotting
import numpy as np

coords = [(0, -52, 18), (-46, -68, 32), (46, -68, 32), (1, 50, -5)]
connectome = np.ones((4, 4))
plotting.plot_connectome(
    connectome, coords, node_color=np.asarray(["red", "seagreen", "blue", "orange"]),
    output_file="/tmp/connectome_example.png")
produces this error:
Traceback (most recent call last):
  File "31-140748.py", line 8, in <module>
    output_file="/tmp/connectome_example.png")
  File "/home/jerome/workspace/nilearn/nilearn/plotting/img_plotting.py", line 1312, in plot_connectome
    colorbar=colorbar)
  File "/home/jerome/workspace/nilearn/nilearn/plotting/displays.py", line 1766, in add_graph
    if node_color == 'auto':
ValueError: The truth value of an array with more than one element is ambiguous. Use a.any() or a.all()
Thanks. I have opened an issue as suggested in the github repo.