I have a task-based fMRI experiment (block design) and I have done a 1st level analysis and defined 2 contrasts of interest.
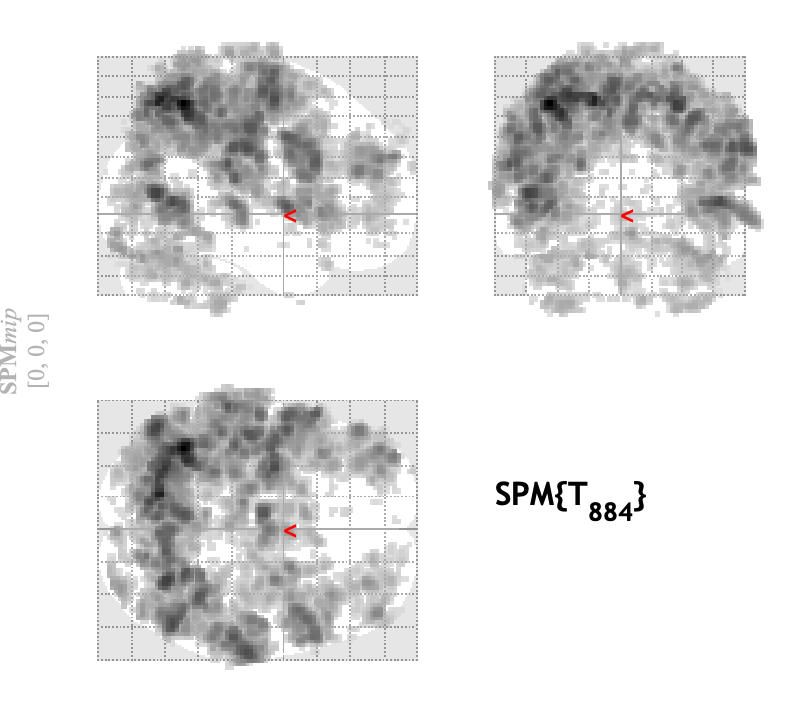
When reviewing the results within each subject (for con_002.nii) I get some nice brain activity like this:
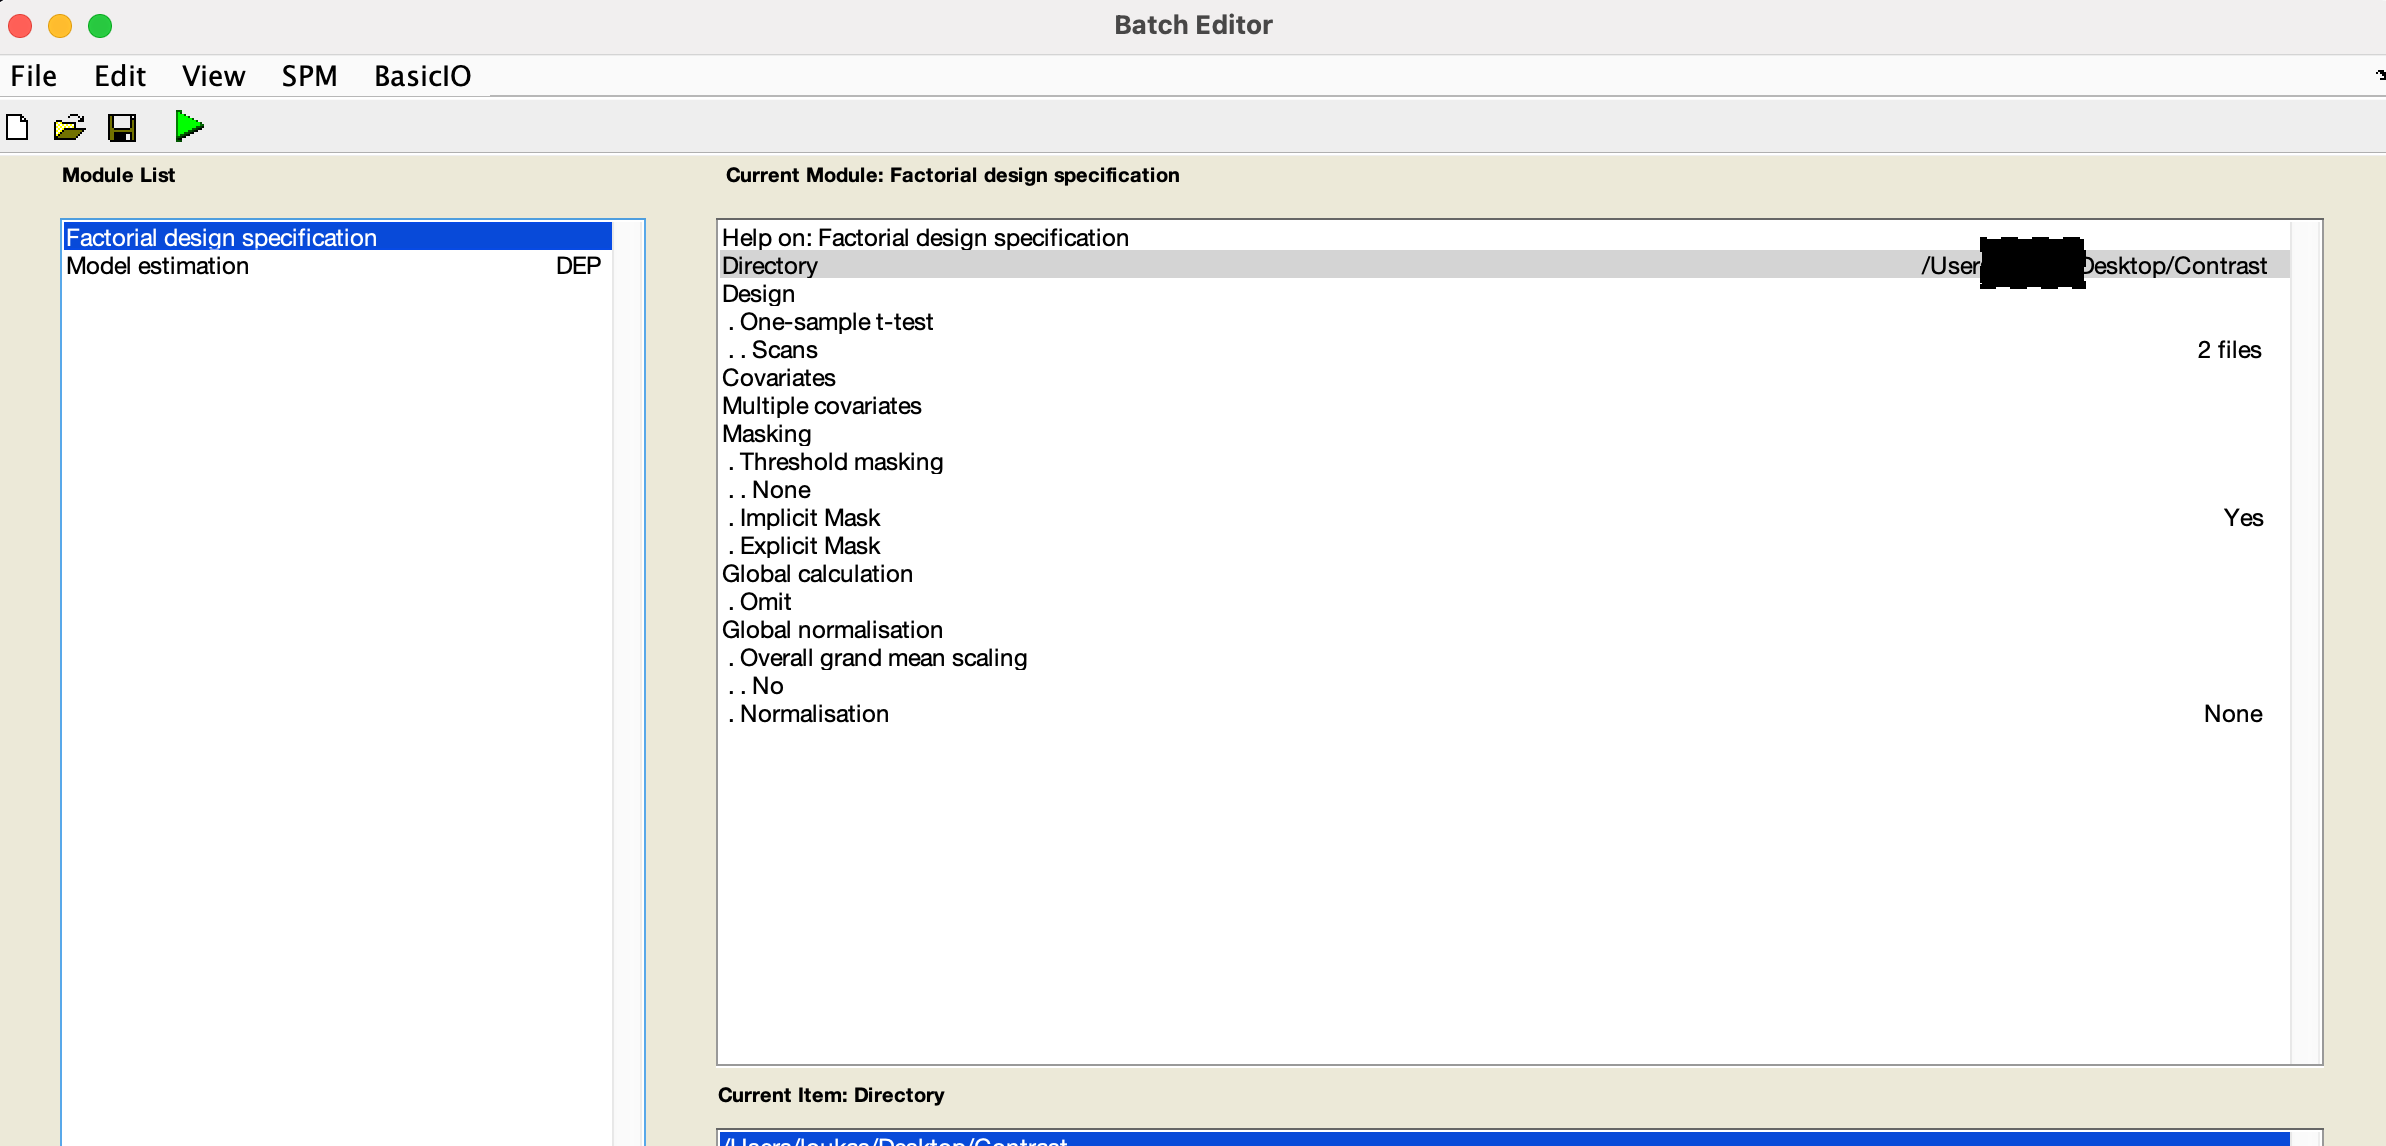
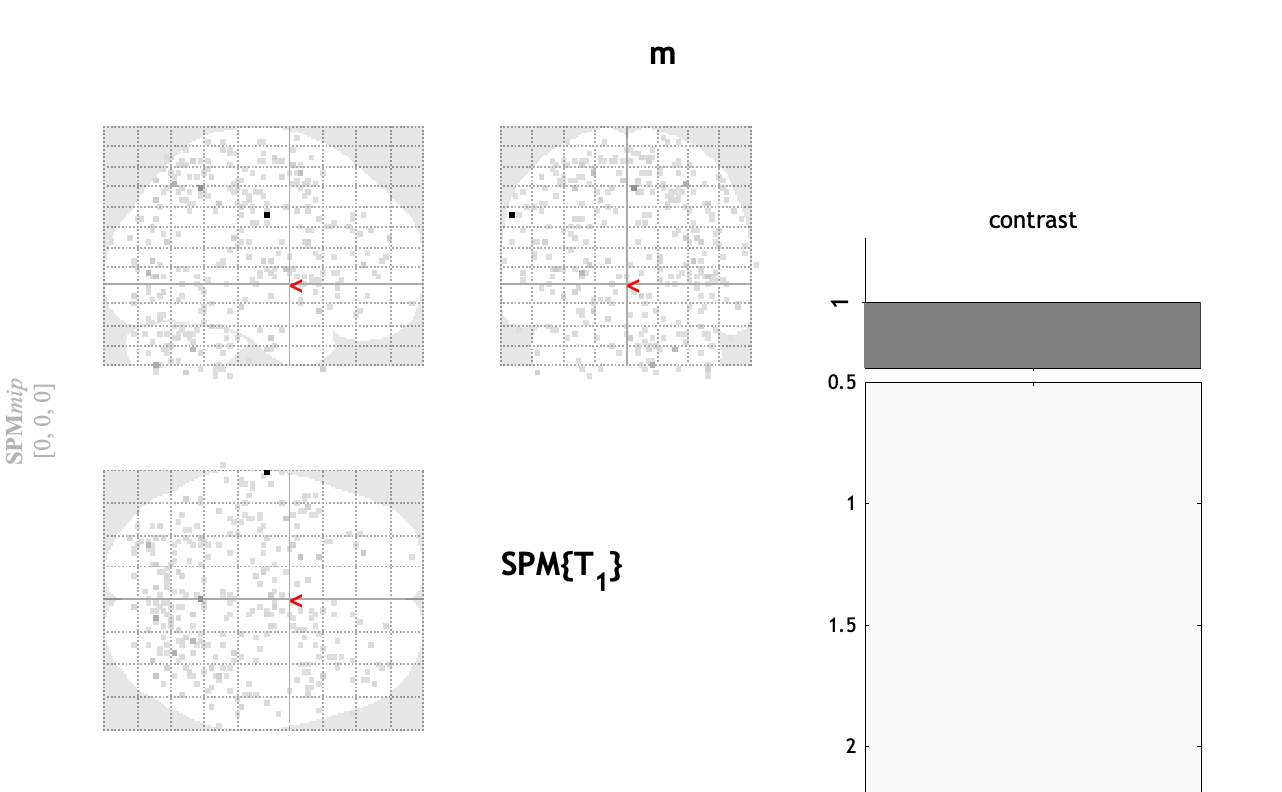
I next run a one-sample t-test using the con_002.nii of only 2 subjects (I do not have more). Mathematically speaking, this is a test to test if the average activity is above 0. However, I get some weird output after running the one-sample t-test (inputs: 2 images i.e. the con_002.nii of each subject).
Any idea why this is happening? Here are the two con files: Send Anywhere
Doing group analysis on very few subjects can often lead to these types of “snow storm” results. With 2 subjects you are very very low statistical power for many effects of interest, so it is unlikely to see anything consistent: or at least I would surprised if did have something poping out.
2 Likes
Clear thanks for the explanation. In my mind, I had that the average of 2 strong activity should lead to another strong activity map.
It could but only for some effects that have a huge effect size like a block design showing a checker board will activate V1.
More concrete advise: try to see if you can have a positive control in your analysis. Something you know should show up with few subjects: the obvious example in many designs are button response presses from the participants. But even for those it may definitely take more than 2 subjects to see something.