Hi all
I have 2 groups of participants and 2 experimental conditions (A and B).
I have used SPM (Matlab) and I have conducted a 1st level and 2nd level analysis for the contrast of interset A > B.
At the 2nd level analysis, the two-sample t-tests (group comparison for the contrast A>B) produced very interesting results in my case (nice clusters of activity).
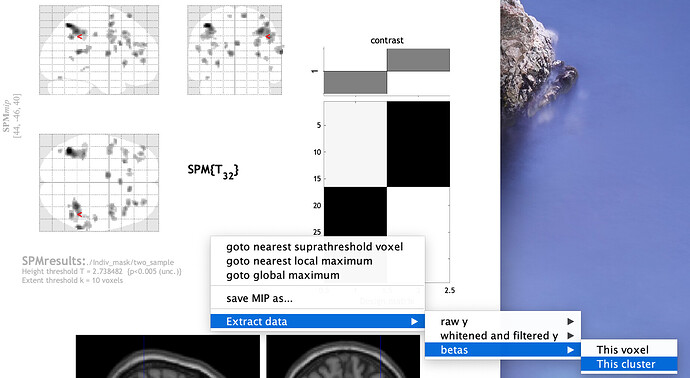
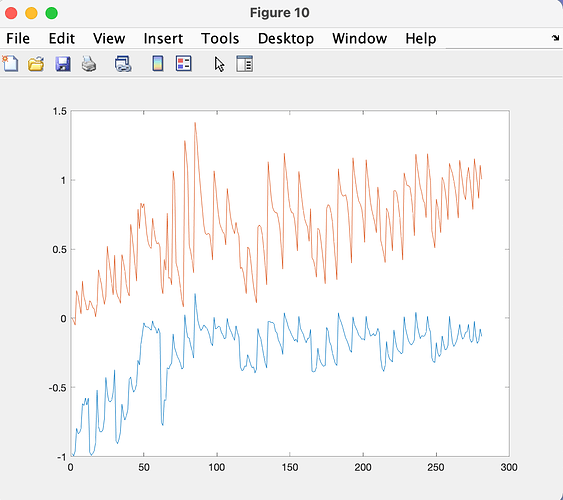
I have then used the option “Extract data” and I extracted the beta estimates (see Fig 1) for a specific cluster (281 voxels in the cluster) and I plot them (see Fig 2).
This is a nice plot but I would like now to extract the brain activity across time (scans) and not the beta estimates for the specific cluster and for all my subjects. Any idea how I can do that?

