Thanks - so if I want to line up the dat[‘response_time’] for a specific trial (e.g. with a value of 1.3 seconds) with a particular 10ms spike bin from that trial, the spike bin at the same time point as that response time would be the spike bin at ~1300ms (bin number 130)?
1 Like
No, sorry, you add 50, because the stimulus/trial start occurs after bin 50.
1 Like
Related question, are the spike times in dat[‘ss’] also relative to stimulus onset? that is, if a spike time occurs at 1.9 s, is that 1.9 s from stimulus onset, or does it also contain the 500 ms pre-stimulus period?
2 Likes
dat[‘ss’] has been referenced from stimulus onset so 0ms is stim onset, but it contains exactly the same spikes as in dat[‘spks’], i.e. the same time range. Pre-stimulus spikes are just negative values.
1 Like
@pachitarium there are plots in the Steinmetz et al. 2019 paper that show data aligned to movement onset time—are movement onset times part of the NMA datasets?
They are not computed in the data released on figshare. I have computed them based on the wheel data and included them in the latest NMA release as reaction_time.
1 Like
Thank you! I wanted to make sure that reaction_time is indeed the thing I am interested in.
For the mouse 11 (the default one) in the LFPs data, why are there two regions with the same name (i.e., DG)?
dat[‘brain_area_lfp’] contains: [‘DG’, ‘LGd’, ‘SUB’, ‘VISp’, ‘ACA’, ‘MOs’, ‘PL’, ‘CA1’, ‘DG’, ‘LH’, ‘MD’, ‘VISam’]
1 Like
That means there was DG on two different Neuropixels probes.
2 Likes
Thanks for doing such a great job on the data loader! According to the Supplementary table in the Steinmetz et al paper, there are 42 regions that have been recorded from. However the data loader notebook lists 72. Were any of the regions combined for analysis? If so, in what way? Or were the 30 extra regions ignored?
I think only the regions with at least N neurons were included in the 42, where N is maybe 100ish?
Good question! I guess we are going in the same direction! good luck! 
1 Like
Thanks for uploading more LFP data! it seem that session 11 is the original one that matches the responses in the main data. Are the responses of the other sessions somewhere else? They have different numbers of trials.
1 Like
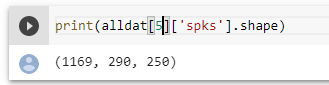
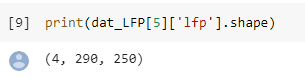
They should be matched for every session. The second dimension is trials, it’s 290 in session 5 for example for both the spikes and the lfp.
2 Likes
Hello all,
Our project group has been interested in using the engagement index presented in the Steimetz 2019 paper (Extended data Figure 9). I’ve tried looking for the code that calculates this index in the github repository (https://github.com/nsteinme/steinmetz-et-al-2019 ) but was enable to locate it. Is it possible to use this resource?
Thanks in advance.
Hi @pachitarium! Would it be possible for you to share a code to compute reaction_time from raw data?
Or is it the matlab findWheelMoves3.m code that you site in the paper? Which parameters have you selected to run it?
And - are reaction times in ms?
Hello people!
We have an issue with the “trough_to_peak” data. Specifically sessions: 7,8,9,18,19,26,34 have different values compared to others. Is the measurement made in micro sec?
Thanks in advance.
Measurement is in samples at the acquisition rate of 30khz. So 10 samples is a 1/3 of a microsecond. Some brain areas have different values, though they shouldn’t vary by more than ~2x. How much variation do you see?
It’s the first 10ms sample after stimulus onset which is >=5 in absolute value. It’s in ms, yes.
Nick doesn’t provide that in the repository, but maybe he has it easily accessible somewhere? @nsteinme
The engagement index is probably something you can define yourselves if it makes sense. No need to exactly follow Steinmetz et al, 2019.