I used nilearn to plot a thresholded (at p<.001) SPM F-map on an MNI template. My idea was to add contours highlighting the clusters surviving cluster-level thresholding, but the binary clusters from SPM did not match the thresholded F-map. Nilearn plots voxels that lies outside what SPM and MRIcroGL displays.
When attempting the same in MRIcroGL, it behaved as expected.
If I multiply the F-map with the mask.nii from the same analysis, nilearn matches MRICroGL.
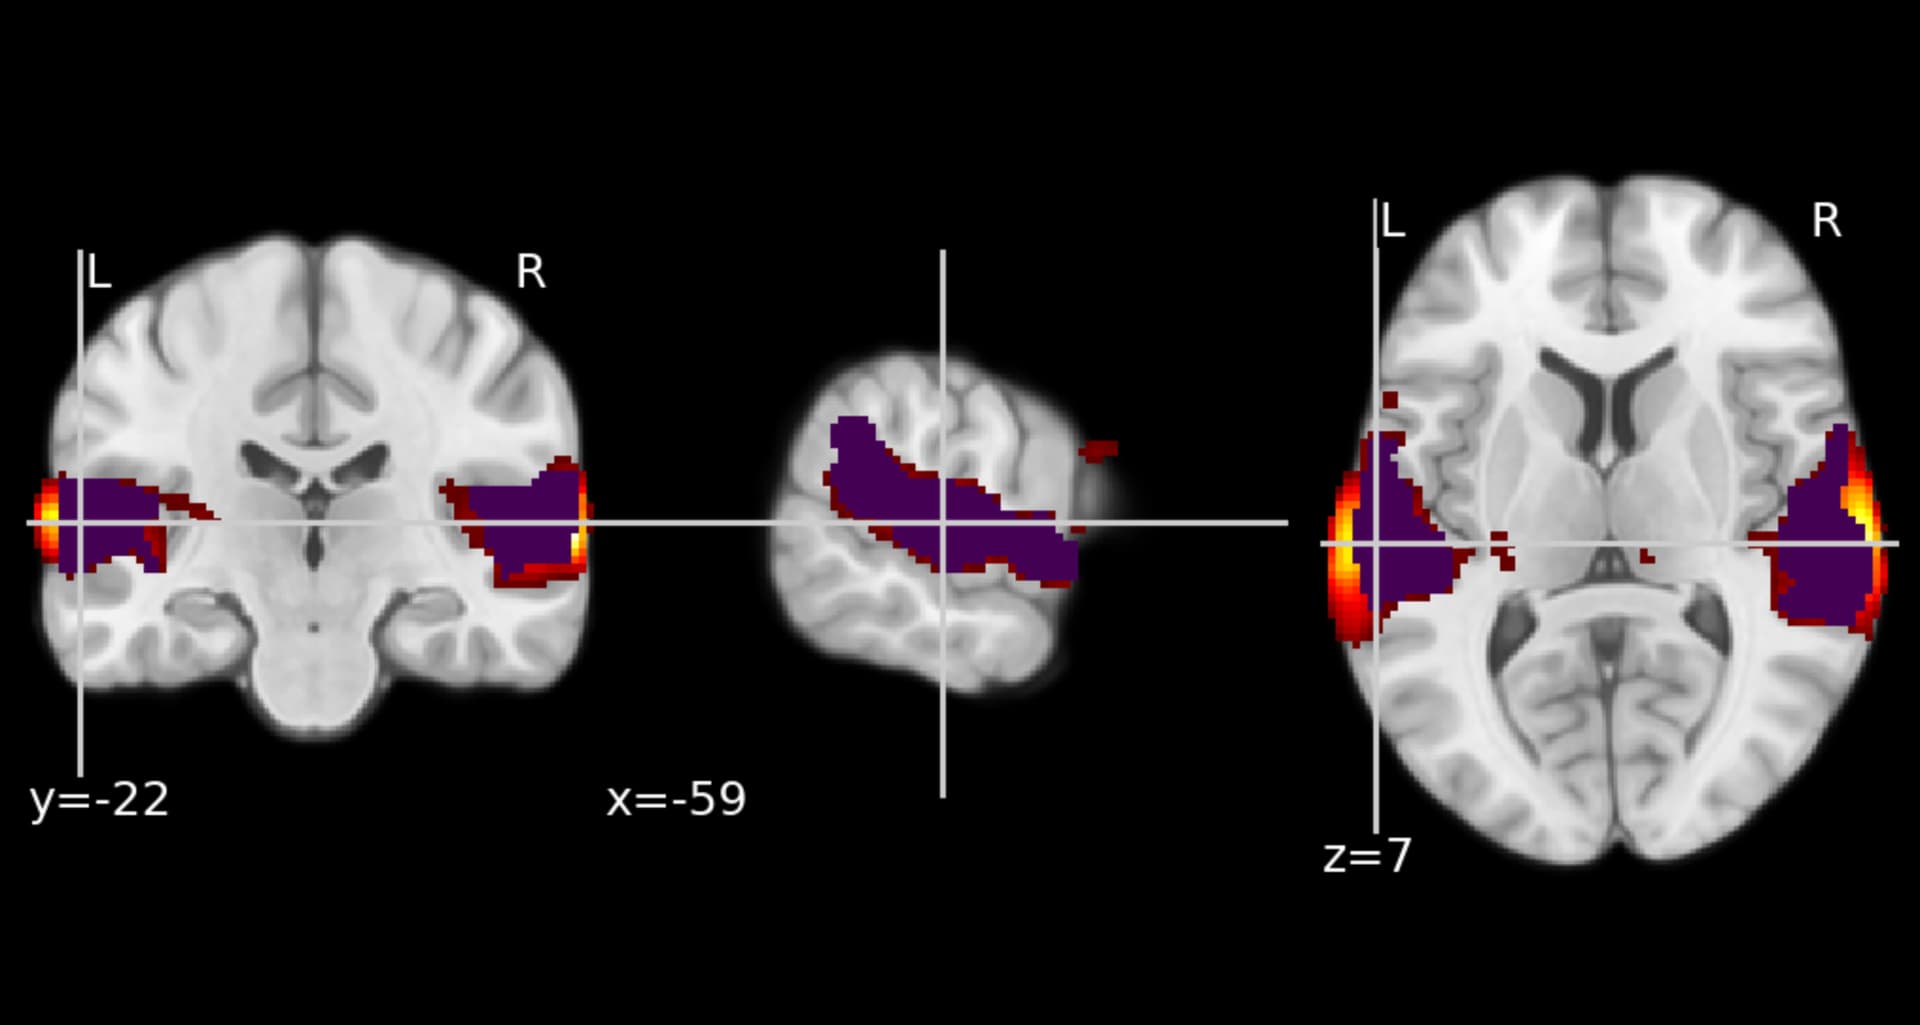
Below is a code snippet for plotting in nilearn along with the output and the corresponding result in MRIcroGL, to illustrate what happens.
mni=os.path.join(root_folder,‘spm152.nii.gz’)
map=os.path.join(seclev_folder,‘owa_events’,‘spmF_0001.nii’)
clust=os.path.join(seclev_folder,‘owa_events’,‘cluster_sig.nii’)
zslice=nilearn.plotting.plot_stat_map(
map,
bg_img=mni,
threshold=4.742159, #p<.001
dim=-.1,
colorbar=False)
zslice.add_overlay(clust)

I’m new to nilearn so it is probably something on my end, but any help is appreciated!