Hello everyone,
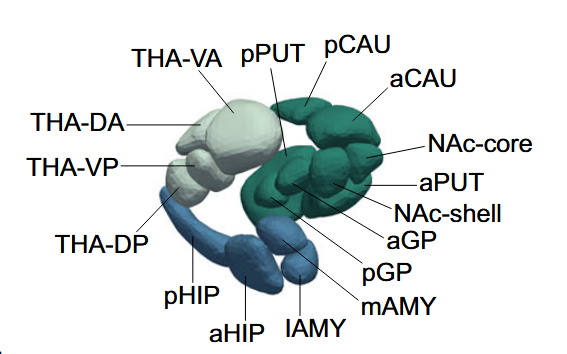
I’m trying to create a visualization similar to the attached image for the Tian32 subcortical atlas (MNI space). I have a volumetric dataset with 32 ROIs, and I want to visualize each ROI as a node where the size/color represents its degree value.
What would be the best approach to achieve this kind of visualization? I’m not looking to show network connections - just need to represent individual ROI values.
Thank you in advance for any suggestions!