I’m to new to nilearn, but your tool seems super useful.
I run simulations on a 30 areas model (V1, V2, V4, DP, MT, 8m, 5, 8l, 2, TEO, F1, STPc, 7A, 46d, 10, 9/46v, 9/46d, F5, TEpd, PBr, 7m, LIP, F2, 7B, ProM, STPi, F7, 8B, STPr and 24c) and I get the firing rate of each of them all along.
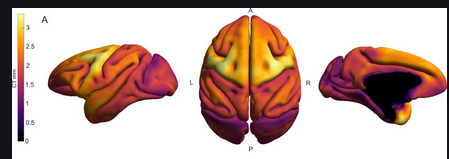
I’d like to have a nice way of plotting snapshots of it. Like turning a (30,) numpy array into the following image:
I couldn’t find any documentation explaining it, but I’m eager to learn how to use your tool!
Hi, welcome to neurostars and nilearn! to use the plotting functions you would need to convert your firing rates to either a nifti image (if they are volumetric data) or a surface image (ie one value for each node of the mesh). how are the regions defined?
I use the M132 brain atlas. And I’d like to build a surface image. If I understand correctly, I just need to have a vector with a value for each area right?
Once I have this vector, what should I do to plot the image?
if it is a 3d image, you can transform your vector of values for each region into a 3d niftiimage using the NiftiLabelsMasker, then plot the results with view_img_on_surf.
if it is a surface map, you will need to transform your vector into a surface map, ie one value for each node in a surface mesh. In this case start from an array of the same size as the atlas data, for each region set the value for all the nodes in that region to the corresponding value in your vector, and pass the resulting map and the mesh to nilearn’s view_surf or plot_surf_stat_map.
Can you share your vector of values and the atlas map? it would make it easier to give a more precise solution