Hi,everyone,
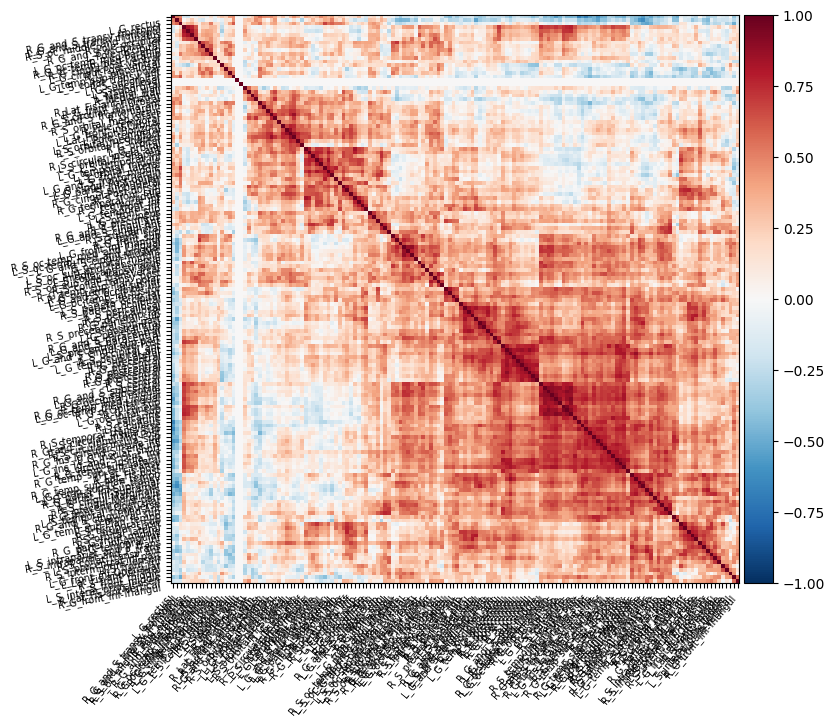
I would like to create resting-state function connectivity matrix based on surface using my output from fmriPrep.Meanwhile,these func-outputs was normalized on fsaverage5 space.I generated a matrix with 75x75 lengths using Destrieux surf atlas in nilearn.However,this matrix makes no distinction between left and right hemisphere.If the template for distinguishing between the left and right hemispheres of the matrix is used, it should be changed to 150x150, therefore I rewrote this script and an error has occurred unexpectedly.
My hope is to create a matrix with 150x150 lengths and side of matrix includes the left and right hemispheres atlases.
Any help would be much appreciated!
Script before modification
import nilearn
from nilearn import datasets,plotting
from nilearn.plotting import plot_stat_map ,show
import matplotlib.pyplot as plt
from nilearn.plotting import plot_connectome, view_connectome
# retrieve the surface altas
from nilearn.datasets import (
fetch_atlas_surf_destrieux,
load_fsaverage,
load_fsaverage_data,
)
from nilearn.surface import SurfaceImage
fsaverage = load_fsaverage("fsaverage5")
destrieux = fetch_atlas_surf_destrieux()
destrieux_atlas = SurfaceImage(
mesh=fsaverage["pial"],
data={
"left": destrieux["map_left"],
"right": destrieux["map_right"],
},
)
print(destrieux_atlas.shape)
label_names = [x.decode("utf-8") for x in destrieux.labels]
print(len(label_names))
# Extract signals on a parcellation defined by labels
from nilearn.maskers import SurfaceLabelsMasker
masker = SurfaceLabelsMasker(
labels_img=destrieux_atlas,
smoothing_fwhm=6,
low_pass=0.08,
high_pass=0.01,
t_r=3,
standardize="zscore_sample",
standardize_confounds="zscore_sample",
labels=label_names,
).fit()
from nilearn.interfaces import fmriprep
confounds_simple,sample_mask = fmriprep.load_confounds([r"D:\T1_Data\sub\sub-042_task-restingstate_hemi-R_space-fsaverage5_bold.func.gii", r"D:\T1_Data\sub\sub-042_task-restingstate_hemi-L_space-fsaverage5_bold.func.gii"],
strategy=('motion', 'high_pass', 'wm_csf'), motion='full',
scrub=0, fd_threshold=0.3, std_dvars_threshold=3, wm_csf='basic',
global_signal='basic',demean=True
)
func_surf=SurfaceImage(
mesh=fsaverage["pial"],
data={"right": r"D:\T1_Data\sub\sub-042_task-restingstate_hemi-R_space-fsaverage5_bold.func.gii",
"left": r"D:\T1_Data\sub\sub-042_task-restingstate_hemi-L_space-fsaverage5_bold.func.gii"
}
)
masker_data = masker.transform(func_surf,
confounds=confounds_simple, sample_mask=sample_mask
)
# plot the functional connectivity matrix
from nilearn.connectome import ConnectivityMeasure
from nilearn.plotting import plot_matrix
correlation_measure = ConnectivityMeasure(
kind="correlation",
standardize="zscore_sample",
)
import numpy as np
connectome = correlation_measure.fit([masker_data])
vmax = np.absolute(connectome.mean_).max()
vmin = -vmax
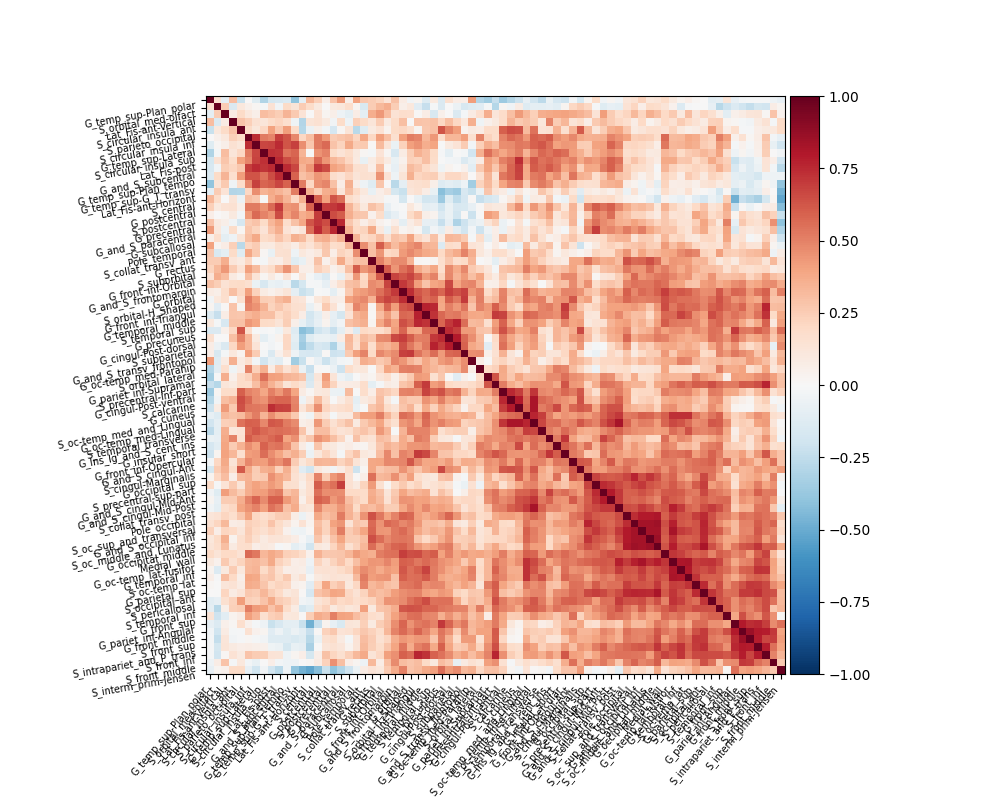
plot_matrix(
connectome.mean_,
figure=(10,8),
vmax=vmax,
vmin=vmin,
reorder=True,
labels=masker.label_names_,
)
show()
Script after modification
from nilearn.datasets import (
    fetch_atlas_surf_destrieux,
    load_fsaverage,
    load_fsaverage_data,
    fetch_atlas_destrieux_2009,
)
from nilearn.surface import SurfaceImage

import nilearn
from nilearn import datasets,plotting
from nilearn.plotting import plot_stat_map ,show
import matplotlib.pyplot as plt


destrieux_vol = fetch_atlas_destrieux_2009()
destrieux_vol_labels = destrieux_vol['labels']


fsaverage = load_fsaverage("fsaverage5")
destrieux = fetch_atlas_surf_destrieux()


labels_name = [x.decode("utf-8") for x in destrieux.labels]


destrieux_atlas = SurfaceImage(
    mesh=fsaverage["pial"],
    data={
        "left": destrieux["map_left"],
        "right": destrieux["map_right"],
    },
)
print(destrieux_atlas.shape)


import csv
import pandas as pd

file_name = r'C:\Users\78270\nilearn_data\destrieux_2009\destrieux2009_rois_labels_lateralized.csv'
#,start_row=2
def extract_column_by_index(csv_file,column_index,start_row=2):
    result = []
    with open(csv_file, 'r', encoding='utf-8') as file:
        reader = csv.reader(file)
        # skip thr header line and second line
        for _ in range(start_row):
             next(reader)
        for row in reader:
            if len(row) > column_index:
                result.append(row[column_index])
    return result

column_index = 1
column_list = extract_column_by_index(file_name, column_index)
print(len(column_list))


from nilearn.maskers import SurfaceLabelsMasker
masker = SurfaceLabelsMasker(
   labels_img=destrieux_atlas,
   smoothing_fwhm=6,
   low_pass=0.08,
   high_pass=0.01,
   t_r=3,
   standardize="zscore_sample",
   standardize_confounds="zscore_sample",
   labels=column_list,
).fit()


from nilearn.interfaces import fmriprep
confounds_simple,sample_mask = fmriprep.load_confounds([r"D:\T1_Data\sub\sub-042_task-restingstate_hemi-R_space-fsaverage5_bold.func.gii", r"D:\T1_Data\sub\sub-042_task-restingstate_hemi-L_space-fsaverage5_bold.func.gii"],
    strategy=('motion', 'high_pass', 'wm_csf'), motion='full',
    scrub=0, fd_threshold=0.3, std_dvars_threshold=3, wm_csf='basic',
    global_signal='basic',demean=True
)

func_surf=SurfaceImage(
    mesh=fsaverage["pial"],
    data={"right": r"D:\T1_Data\sub\sub-042_task-restingstate_hemi-R_space-fsaverage5_bold.func.gii",
    "left": r"D:\T1_Data\sub\sub-042_task-restingstate_hemi-L_space-fsaverage5_bold.func.gii"
    }
)


masker_data = masker.transform(func_surf,
     confounds=confounds_simple, sample_mask=sample_mask
)

# plot the functional connectivity matrix
from nilearn.connectome import ConnectivityMeasure
from nilearn.plotting import plot_matrix

correlation_measure = ConnectivityMeasure(
    kind="correlation",
    standardize="zscore_sample",
)

import numpy as np
connectome = correlation_measure.fit([masker_data])


vmax = np.absolute(connectome.mean_).max()

vmin = -vmax
plot_matrix(
    connectome.mean_,
    figure=(10,8),
    vmax=vmax,
    vmin=vmin,
    reorder=True,
    labels=column_list
)
show()
terminal errors
PS D:\env> & d:/env/.venv/Scripts/python.exe d:/python311/train.py
[get_dataset_dir] Dataset found in C:\Users\78270\nilearn_data\destrieux_2009
[get_dataset_dir] Dataset found in C:\Users\78270\nilearn_data\destrieux_surface
(20484,)
150
D:\env\.venv\Lib\site-packages\sklearn\utils\_set_output.py:319: UserWarning: Parameter smoothing_fwhm is not yet supported for surface data
  data_to_wrap = f(self, X, *args, **kwargs)
Traceback (most recent call last):
  File "d:\python311\train.py", line 114, in <module>
    plot_matrix(
  File "D:\env\.venv\Lib\site-packages\nilearn\plotting\matrix_plotting.py", line 298, in plot_matrix
    labels, reorder, fig, axes, own_fig = _sanitize_inputs_plot_matrix(
                                          ^^^^^^^^^^^^^^^^^^^^^^^^^^^^^
  File "D:\env\.venv\Lib\site-packages\nilearn\plotting\matrix_plotting.py", line 61, in _sanitize_inputs_plot_matrix
    labels = _sanitize_labels(mat_shape, labels)
             ^^^^^^^^^^^^^^^^^^^^^^^^^^^^^^^^^^^
  File "D:\env\.venv\Lib\site-packages\nilearn\plotting\matrix_plotting.py", line 103, in _sanitize_labels
    raise ValueError("Length of labels unequal to length of matrix.")
ValueError: Length of labels unequal to length of matrix.