T2starmaps with splendid multiband boundaries

I’ve begun exploring and experimenting with (very) pilot data from a new 7T scanner. Nearly every run uses a slightly different acquisition protocol; combinations of 3-5 echoes, multiband acceleration of 4-6, in-plane GRAPPA acceleration of 2. (Apologies for the vagueness; I’m happy to share details/files/etc., but didn’t want this to be even longer.)

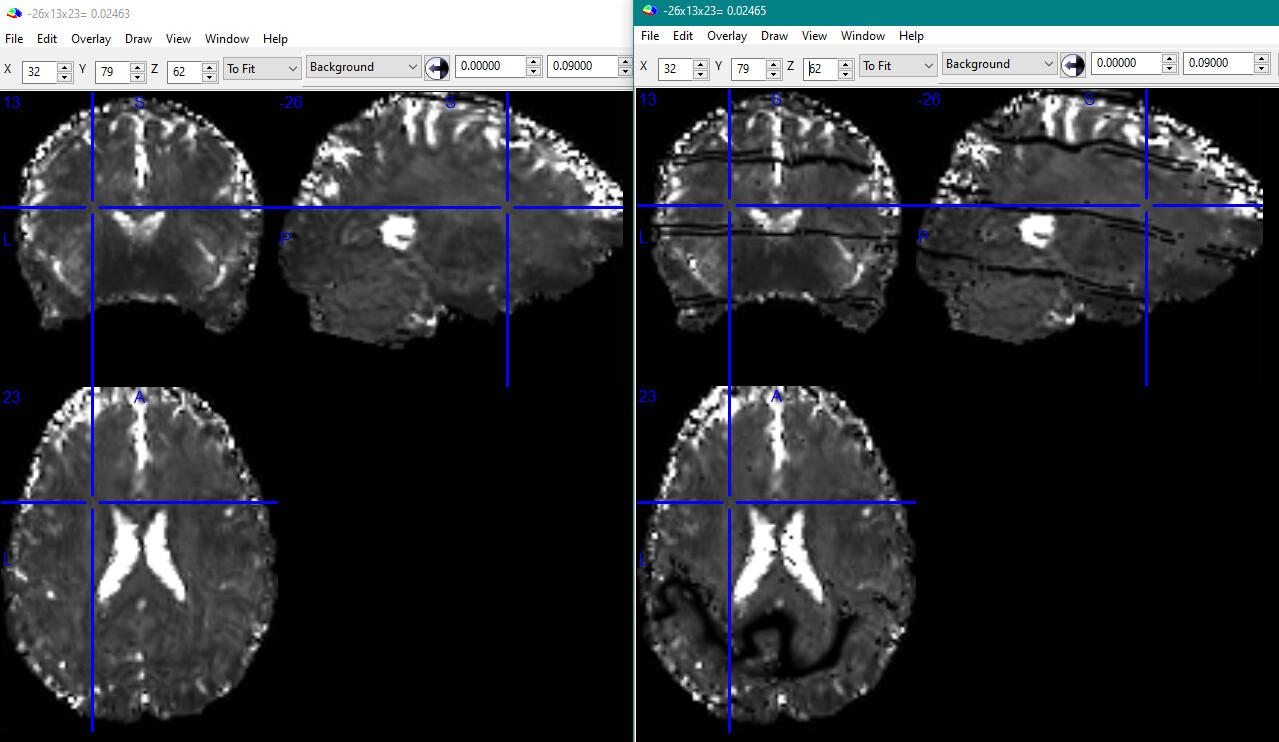
Getting towards my question: using fMRIPrep for preprocessing (command below), when I include multiple echoes in the dataset it writes a single bold.nii.gz as expected, with accompanying T2starmap.nii.gz (and many other files). Most of the outputs look fine, but the combined 4d bold and T2starmap have matching very obvious black lines:

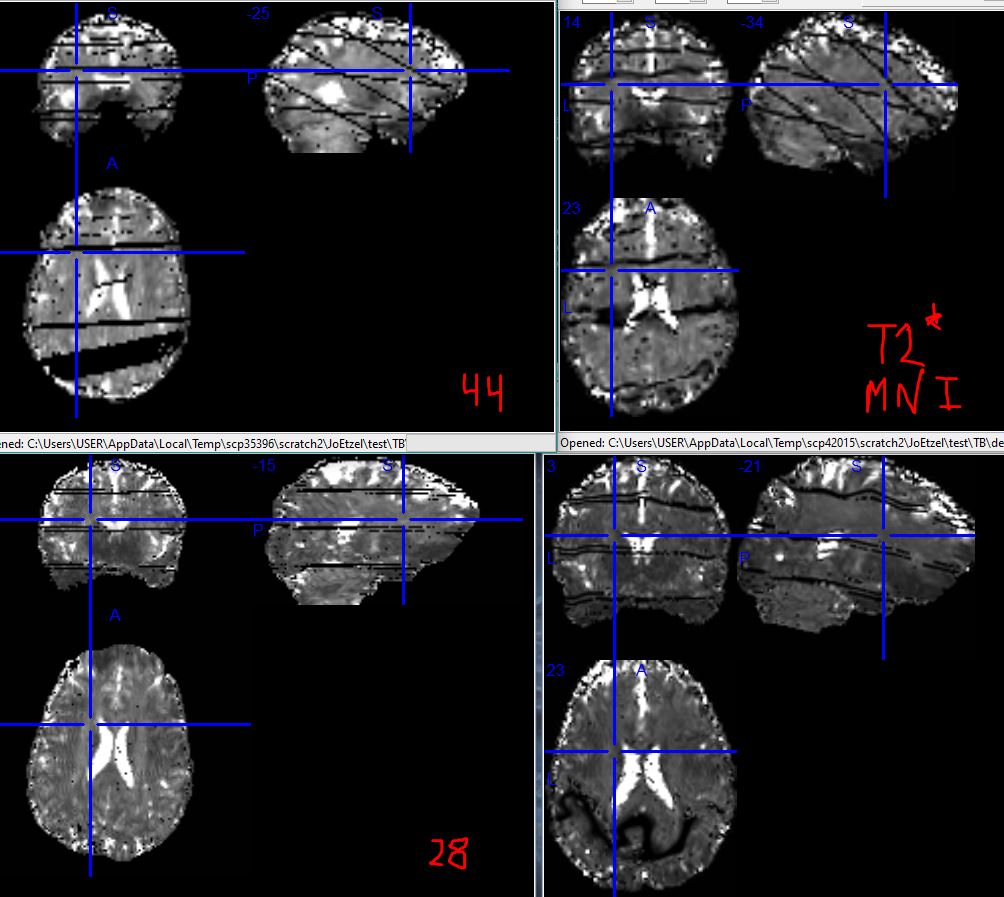
Above are examples for two runs (same person and session, different acquisitions), 44 (top row) and 28 (bottom row). The left column is subject space (/t2s_reporting_wf/clip_t2star/T2starmap_clipped.nii.gz), right MNI (_space-MNI152NLin2009cAsym_T2starmap.nii.gz). Both of these runs were multiband 4, and the horizontal lines in subject space are where the multiband boundaries ought to be. I don’t know offhand why 44 has diagonal lines and 28 does not, but the perfect geometry makes it seem safe to assume it has something to do with the acquisition parameters. (MB5 and MB6 runs have correspondingly more horizontal lines in their output.)

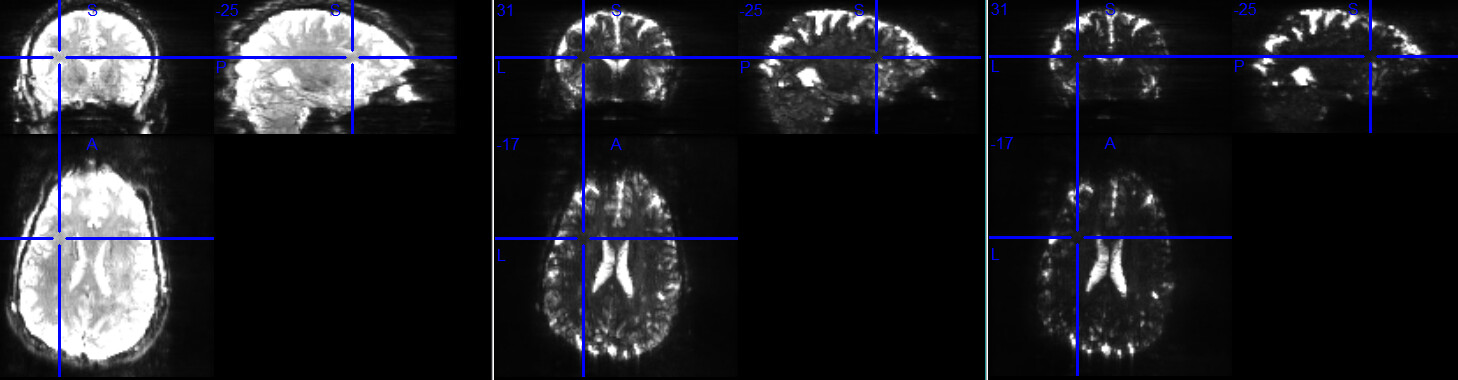
These black lines are only so obvious in the tedana-combined output, not if fmriprep is run with only one echo in the BIDS dataset, nor if its call includes --me-output-echos. Temporal standard deviation images (below) of the functional runs before preprocessing look more or less as I expected; these are for the three run 28 echoes (same color scaling in all three):

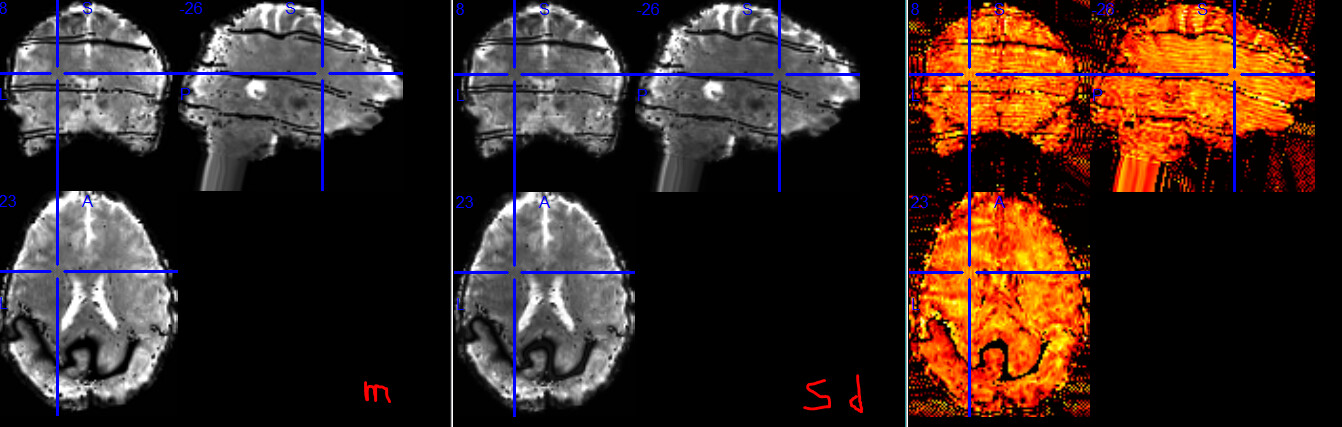
I suspect tedana is identifying the multiband boundaries (and maybe something GRAPPA-related?) as noise; their removal causing the black lines in the combined image. For a final example, below are temporal mean, standard deviation, and tSNR images of the combined run 28 (_run-28_space-MNI152NLin2009cAsym_desc-preproc_bold.nii.gz):

The actual questions (:sweat_smile:): Is this sort of “striping” behavior expected in optimally combined images (a sign of too much acceleration, perhaps?), or a bug somewhere in my logic, procedures, or the software? Any suggestions for how to investigate further?

We have another pilot session scheduled next week, so can try different acquisition parameters; any suggestions? These stripes have appeared in all runs I’ve processed so far; three different participants and sessions.

Thanks!

fMRIPrep version: 25.1.0
fMRIPrep command: /opt/conda/envs/fmriprep/bin/fmriprep --fs-license-file /tmp/.license/freesurfer/license.txt -w /tmp /tmp/BIDS /tmp/derivatives participant --participant_label TB --output-spaces MNI152NLin2009cAsym --n-cpus 16 --omp-nthreads 4 --mem-mb 64000 -v --fs-no-reconall

It’s definitely not expected. The T2starmap is calculated after slice timing correction, motion correction, and susceptibility distortion correction, so maybe one of those steps introduced the artifacts? Alternatively, it could be that there are certain frames in the time series that are causing the artifact.

Any chance you could share the minimally preprocessed echo-wise files (from --me-output-echos), native-space brain mask, and confounds tsv from one of these runs?

1 Like

Looking at a few runs, the last few (3?) frames of each are very dark, both in the dicoms and dcm2niix-converted nii.gz; in at least some of the derivatives images the last frames are multiband-ish striped. I hadn’t thought much of the dark last few frames, but I’ll try to cut them before preprocessing to see if it helps.

[edited to delete the file and link]

Is there any chance those last three volumes are no-RF noise volumes (e.g., for NORDIC)?

Unfortunately, the link won’t let me download without being granted access, but if the problem ends up being noise volumes at the end of the scan I might not need access to the data.

Good catch! Those are indeed noise volumes: “EPI noise scans” is 3. We also have separate phase “runs” (I’m not sure what exactly to call them; a full set of “Pha” dicoms are written for each functional run), which look quite different and I haven’t been using them in preprocessing (yet). I have been including the pair of spin-echo fieldmaps (with B0FieldIdentifier & B0FieldSource in the jsons).

I was thinking I could do a quick test by deleting the last dozen dicoms (this run has three echoes) before running dcm2niix … but that’s not getting rid of them all, so I’ll dig into the documentation after lunch and see if I can figure out how to properly handle these.

Thanks!

In recent BIDS releases, we have a separate suffix for those volumes. The idea is, as part of curation, you should split them out of the _bold NIfTIs and use the _noRF suffix. I’ve never tried removing DICOMs- I just convert to NIfTI and split after.

If you plan to run NORDIC on these data, then you have to reconcatenate them, explicitly set the slope and intercept to 1 and 0, respectively, process them with NORDIC, and then resplit them. It’s a complicated workaround, so it might be easier for you to run NORDIC on the full NIfTIs first, then split the noRF volumes out after the files have been denoised.

Neither fMRIPrep nor tedana can leverage phase data yet, but I’m hopeful that’ll change. Just make sure you have the part-mag in your magnitude filenames and part-phase in your phase filenames.

There are a bunch of cool applications for phase data though, including: better thermal noise removal with NORDIC or MP-PCA (thermal noise is Rician in magnitude-only data but Gaussian in complex-valued data, which is apparently better); extraction of phase-based confounds like HighCor (Curtis and Menon, 2014) and respiratory signal (Jaffray et al., 2024); calculation of phase-based derivatives like phase jolt (see Applying LN2_PHASE_JOLT to multi-echo data); phase regression (e.g., Stanley et al., 2021); complex ICA (Calhoun et al., 2002), and complex-valued modeling (e.g., Adrian, Maitra, & Rowe, 2018).

There are also some pretty cool multi-echo-specific applications, like better R2* estimation (Cohen-Adad et al., 2012); dynamic distortion correction with the MEDIC method (Van et al., preprint); functional quantitative susceptibility mapping (Balla et al., 2014); and EPI-QSM (basically just the fQSM time series averaged over time) (Kiersnowski et al., 2024).

Sadly, most of those applications aren’t supported in popular pipelines like fMRIPrep. I’m hoping to at least implement some of the post-processing methods (phase regression, phase jolt derivatives, etc.) into a BIDS App at some point (see GitHub - nipreps/fmripost-phase: An attempt at an fMRIPost workflow for handling phase data), but haven’t had much time to dedicate to it yet.

I’ll mark this as solved, thank you!

Below is the same run 28 T2starmap.nii.gz as before, but left is when the last 9 (3 * 3 noise scans) .dcm files were deleted from the dicom directory prior to running dmc2niix. (I confirmed that all three echo’s BIDS .nii.gz had brains in all frames, and then ran fmriprep as before.) The combined output timeseries also looks much better - no stripes.

I’ll be running more tests and plan to share details on my blog as they develop. We may indeed try NORDIC or other denoising in the future, but this (hopefully) will be a starting point.