Hi all,
I’m going through tedana (v0.0.10) component reports from a large data set, and performing manual re-classification of some components. I’ve come across a few components that I’m not sure how to classify, and thought I would ask for others’ perspectives.
The hard-to-classify components virtually always lie around the middle of the kappa rho plot, with relatively high kappa and rho values. When they are rejected, the stated reason is usually I007, 009, or 010. Here are examples of two such components (4 and 6) from one dataset:
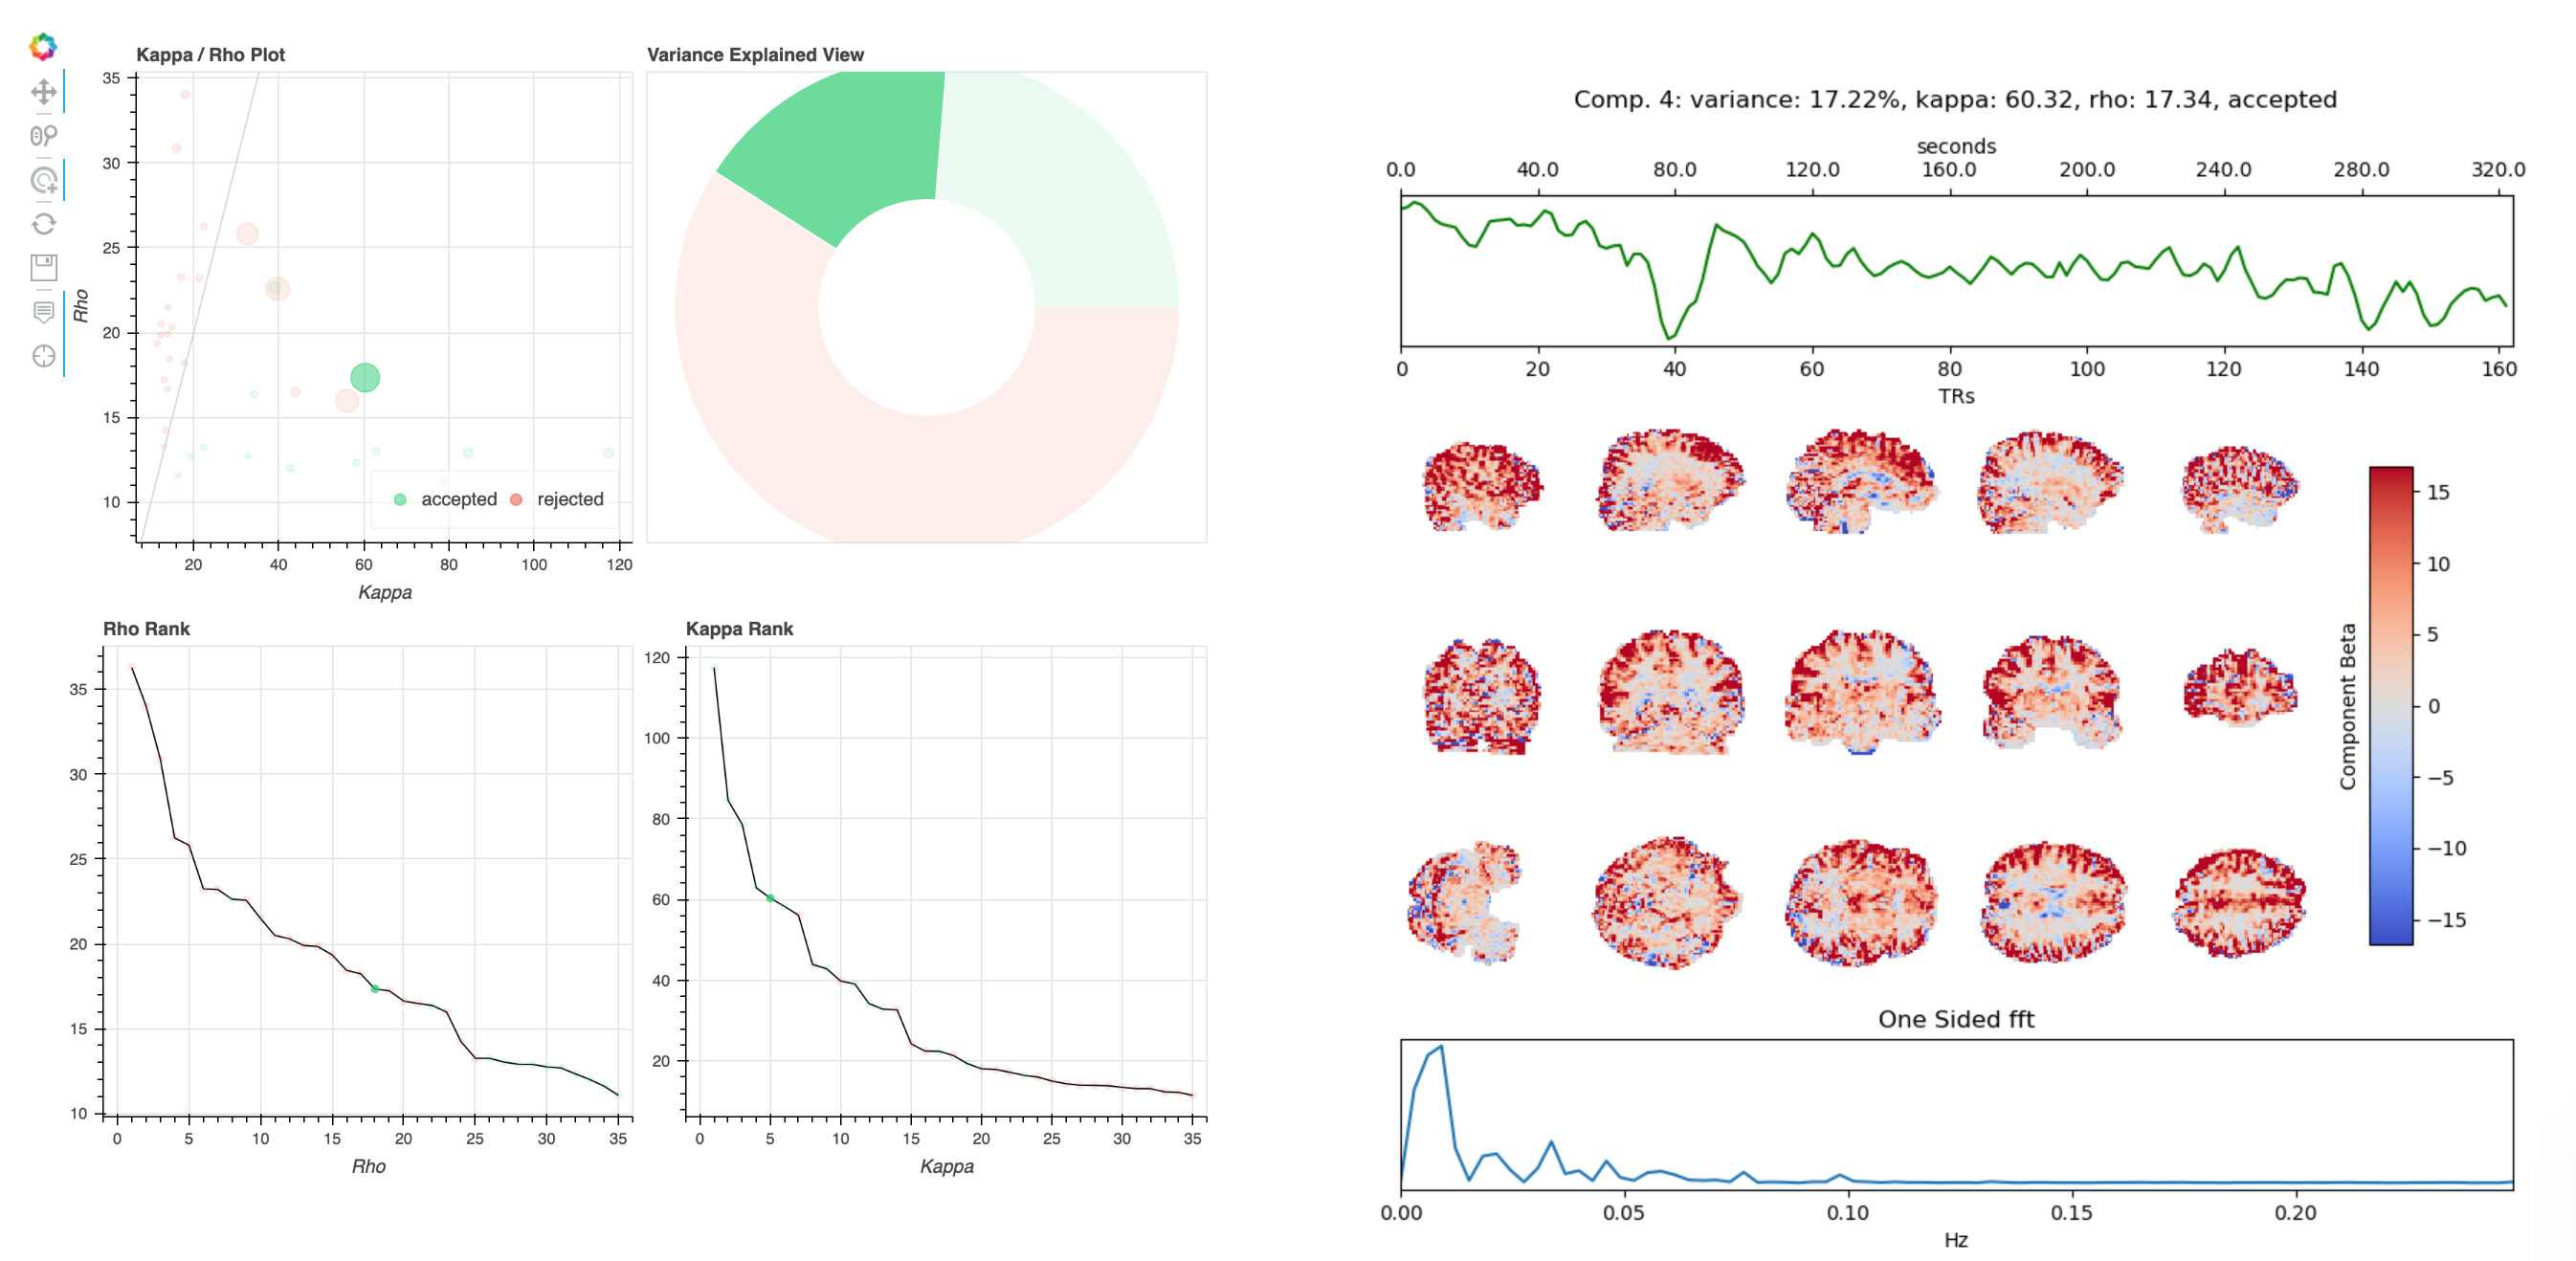
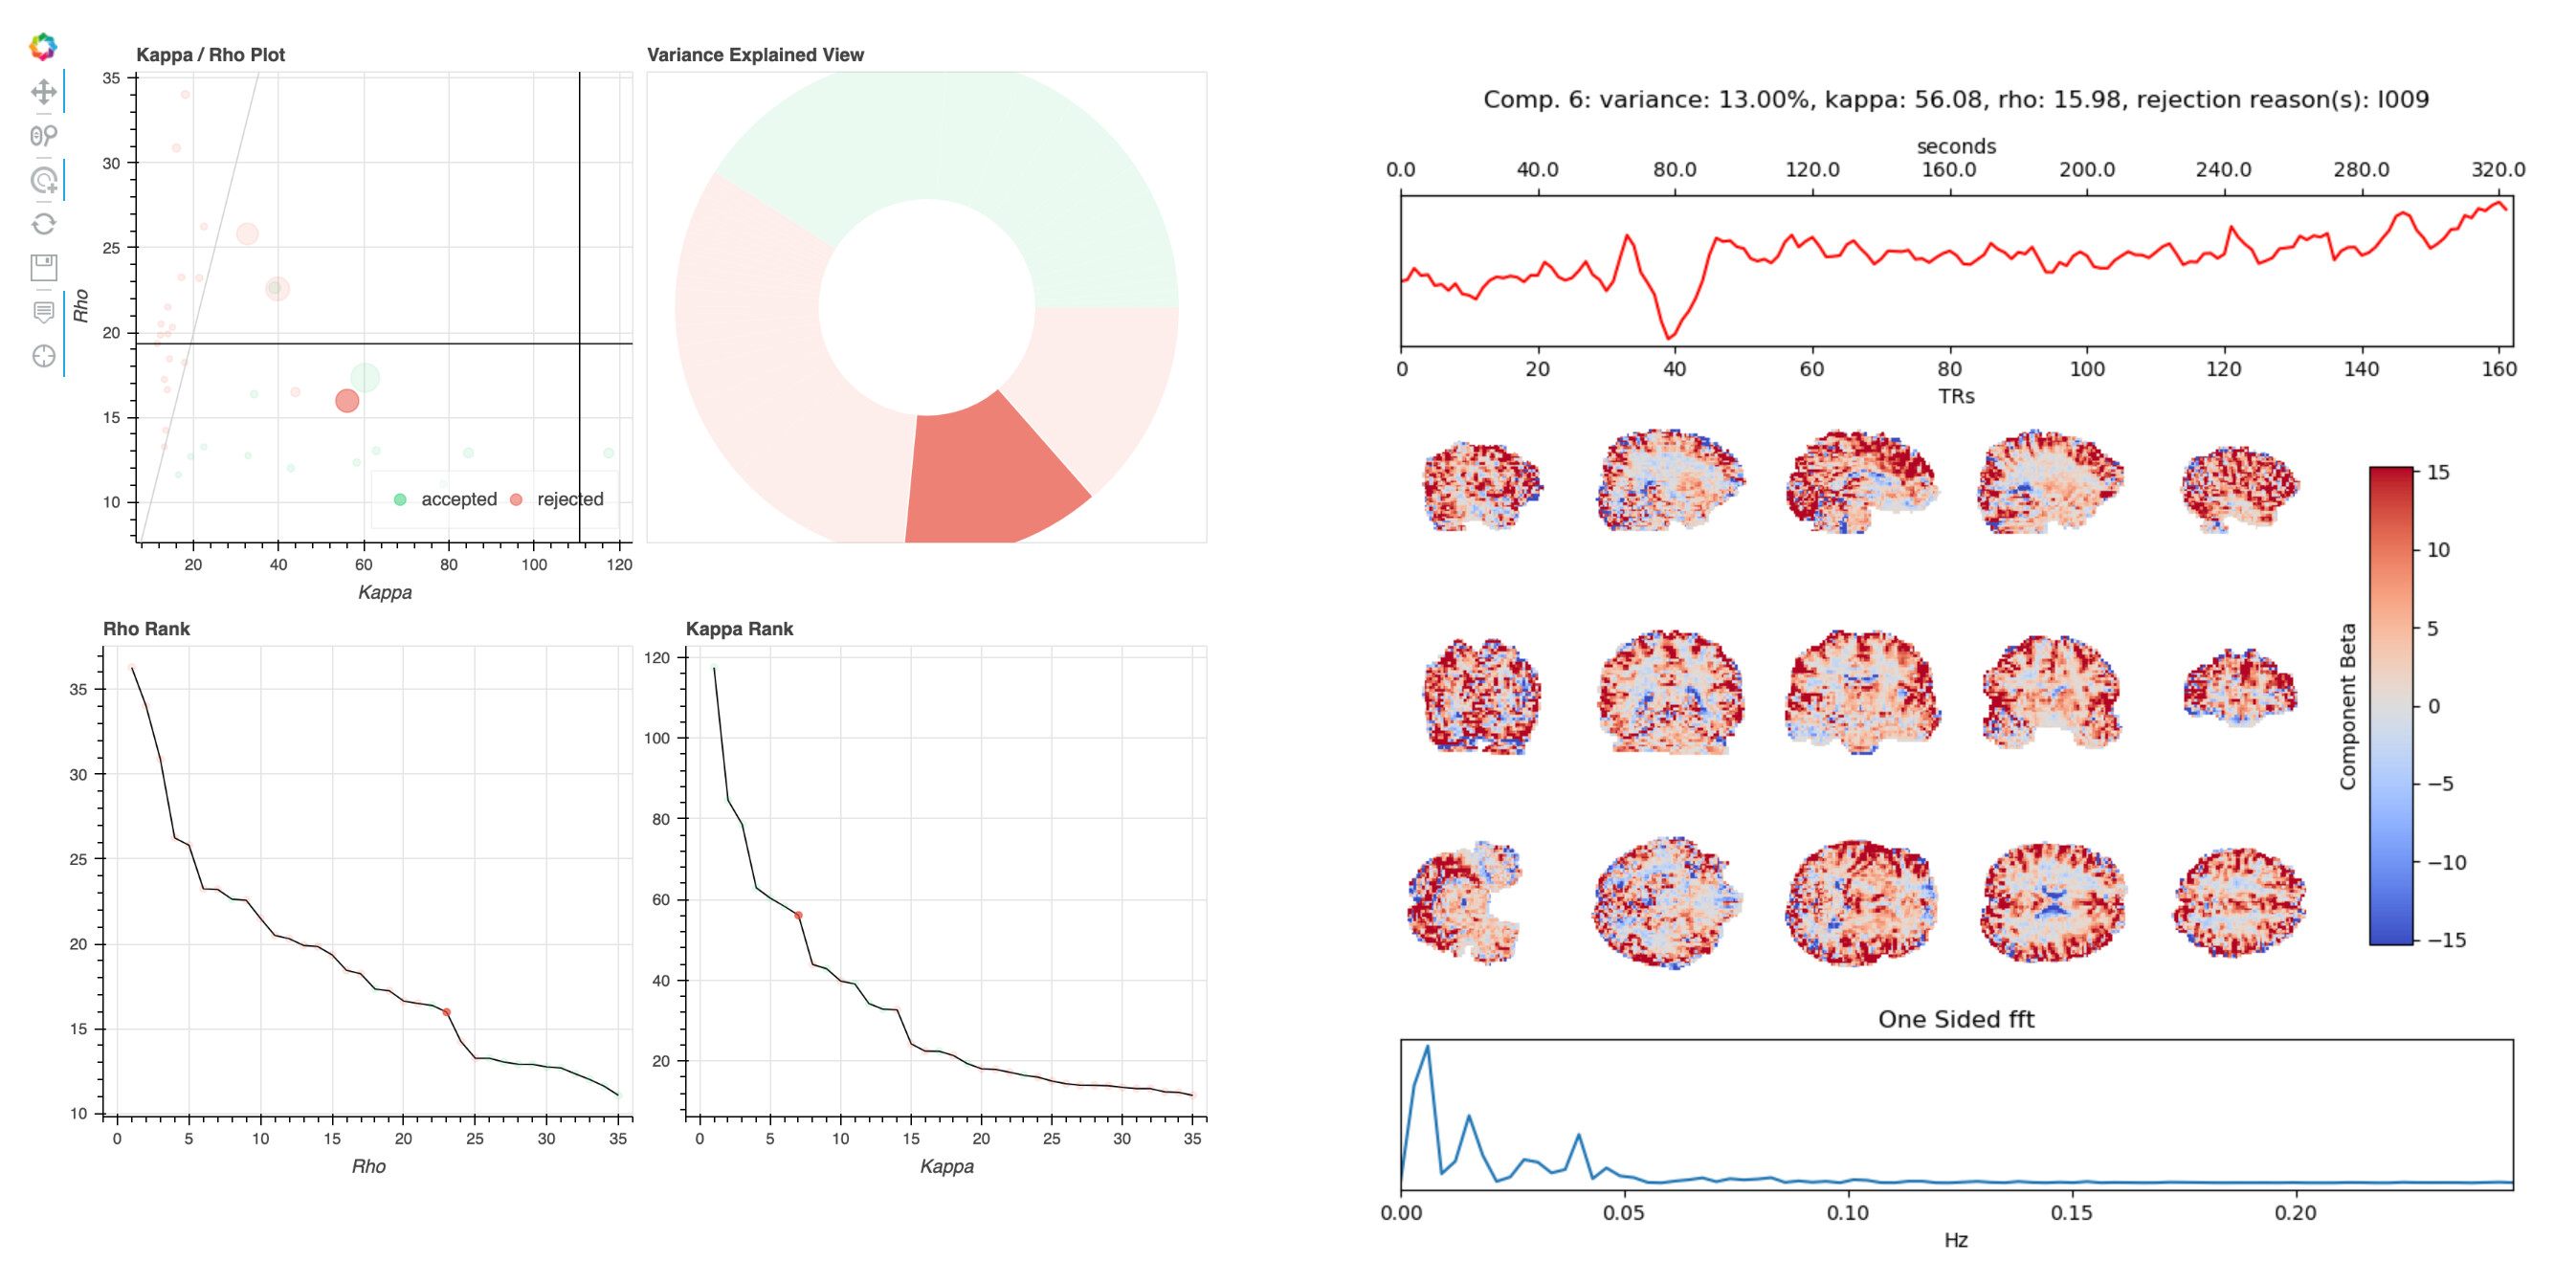
These components are similar overall, but tedana rejects one and keeps the other. Both components have positive weights across most of gray matter, and their time series have some variance at drift-like frequencies (<.01Hz), but also some variance in frequencies typical of BOLD-driven variation (.01-.1Hz).
The rationale for rejecting such components, from Kundu et al. 2013, is that they localize to “they localize to the sagittal sinus and draining veins indicating pCO2 fluctuations.” However, the weights in these components are not localized to draining veins, but extend across gray matter. Other components have a spatial profile that seems more consistent with draining veins, e.g. 10:
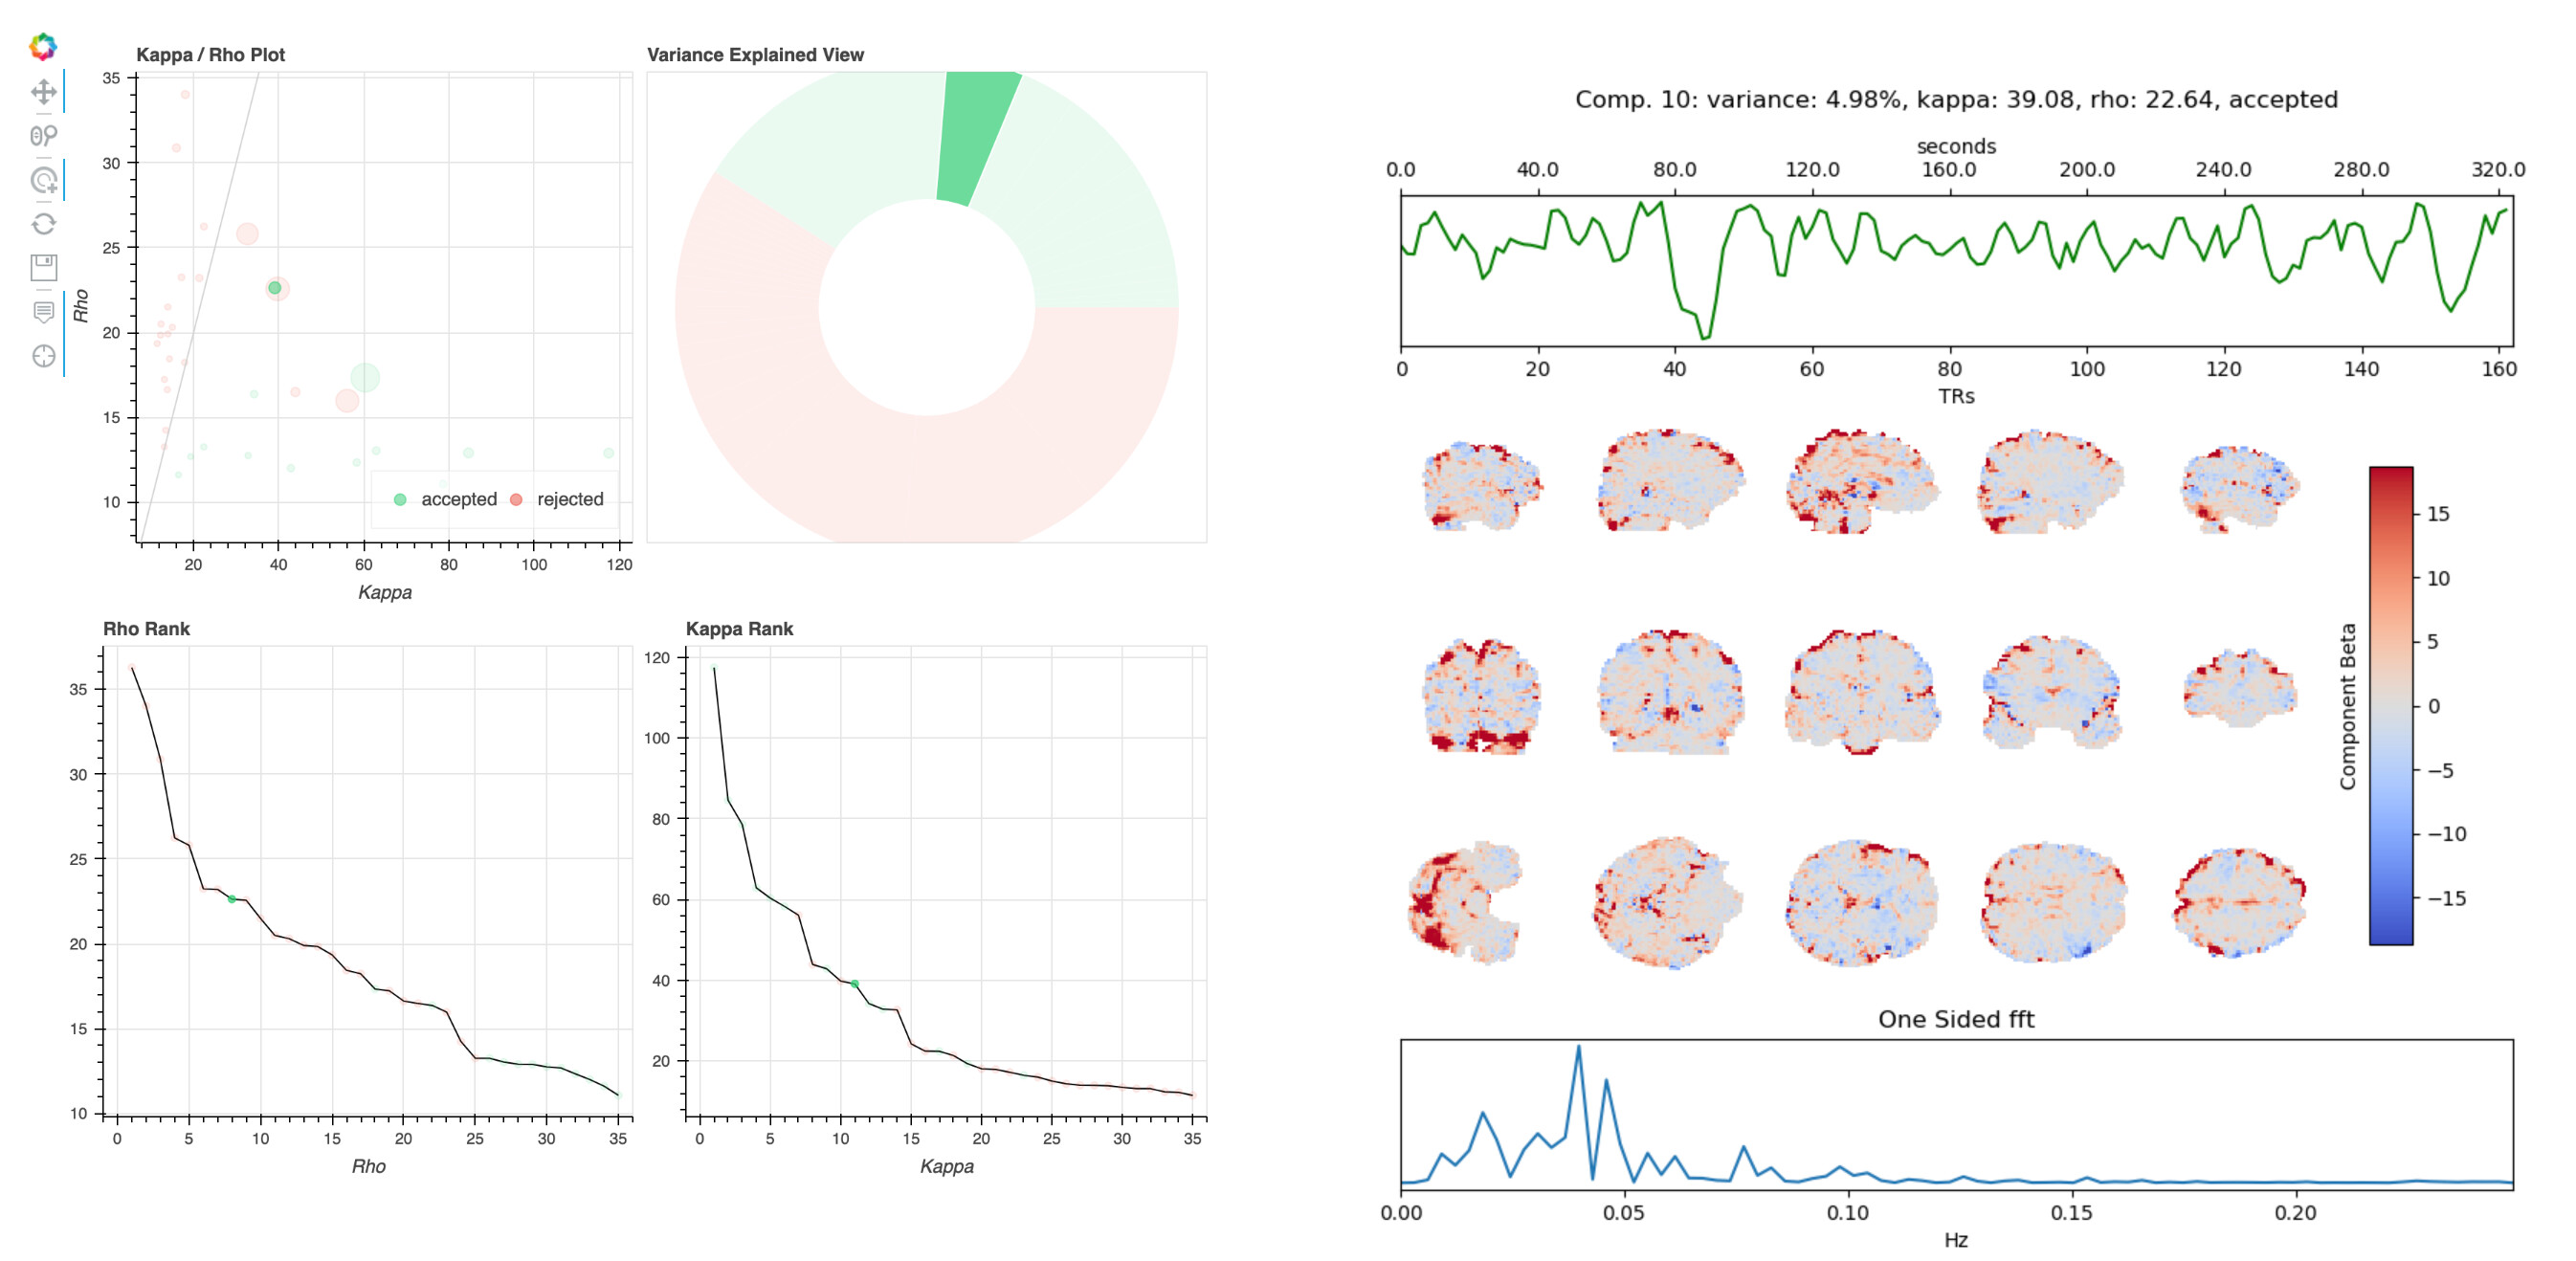
This component was accepted, although components with similar spatial profiles in different tasks/runs from this participant were typically rejected.
What do folks think about these components? Would you classify them as BOLD or non-BOLD? Is there any principled basis for differently classifying components 4 and 6? Thanks,
Ben