Thanks all for explaining the pca method in more detail. I ran mdl, kic, and aic with the fmriprep explicit mask on 16 subjects (tedana_tests_txt.txt (1.4 KB) ). The average total and accepted components are mdl (32, 8), kic (48, 10.5), and aic (55, 12).
If helpful, I can send the tedana reports for each method for a low # of components subject and typical subject. To an earlier point, the adaptive mask initialized with the fmriprep bold mask does not seem overly aggressive.
Steps in progress:
I’m running meica v3.2 on a few folks now. Using afni code from a previous study in our lab for better internal comparison (although these data are from a different site, 1s vs 3s TR, etc). Will update when I have that output.
getting the matrices passed to maPCA to check mdl, kic, and aic values.
I will take a closer look at the reports to see if components are being ‘misclassified’ or differently classified for some subjects (e.g., bold-looking component in one subject is rejected in another).
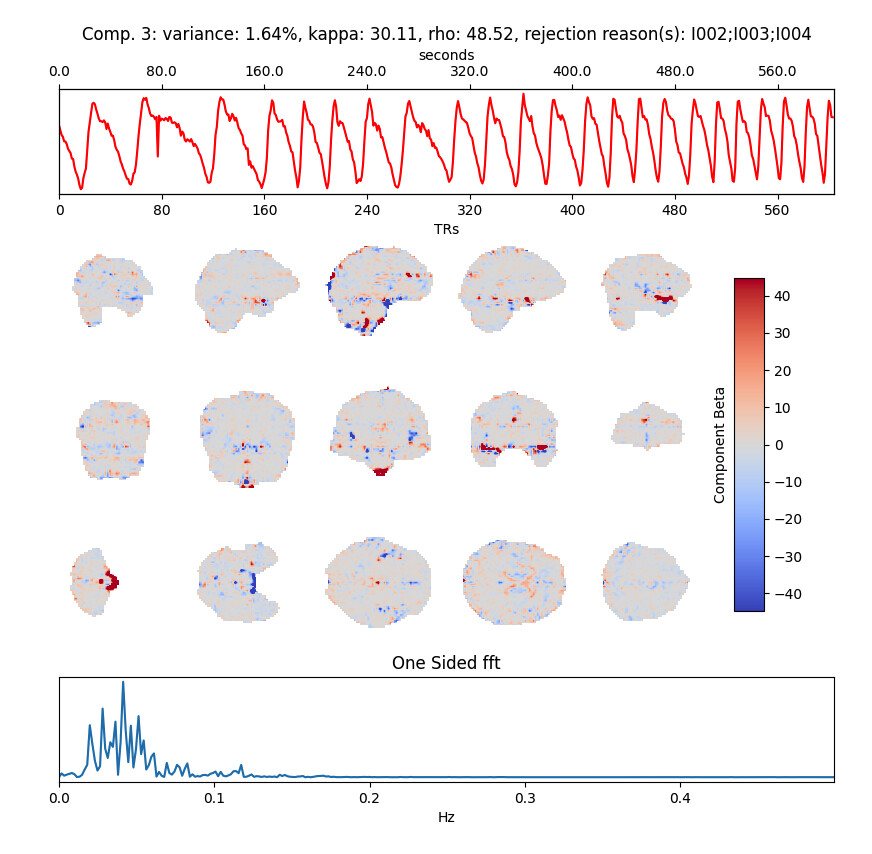
Jumping in here to draw attention to something I noticed in sub-0082 that really stood out to me - there is a strong ‘sawtooth’ pattern for the aic version, in components 2,3,8, 22, 25, 40, 51 and a similar frequency (or at least somewhat similar) oscillation in 6 and 41. This isn’t specifically tedana’s doing, but its making me wonder whats going on (and if it is contributing to your problems). Its extremely regular, and isolated to the vasculature to my eye, example:
I don’t see anything even close to this in the other dataset.
I also want to point out that the under-documented method @handwerkerd mentioned that uses a wildly different PCA selection method is still available by using ‘kundu’ as the --tedpca option (rather than mdl, aic etc). There is of course a reason it is somewhat hidden but in my hands it has had dramatic effects on the number of components - though whether that is a good thing for this data remains to be seen. It also increases the number of potential comparisons, which makes things more complicated for you.
Oh interesting, thanks for taking a look. I’m checking through the other test subjects now and will keep an eye out to see if it’s systemically related to folks with few total/accepted components. Probably worth checking the inputs too.
I saw the kundu option but I wasn’t sure at first glance how to reconcile it with the range of other options, including the meica.py scripts. Will give it another look.
@e.urunuela I added the npy files in the corresponding aic, kic, mdl directories for those two test subjects. These are older adults so they might tend to have fewer components than younger adult datasets.
@dowdlelt of my 16 test subjects I saw a few similar components in ~2 other people across mdl, kic, aic. I don’t know what to make of the potential source of the ‘sawtooth’ pattern, however. Will poke around more this week. I saw a few rejected components that could perhaps be manually classified as accepted but this was not common.
I ran meica.py v3.2 on 5 subjects (i.e., afni preproc + meica v3.2). Found comparable #s to another older adult resting-state dataset we processed this way. Average 112 total and 25 accepted, ~92% variance. afni_meica3.2_out.txt (177 Bytes)
Next, I will feed meica3.2 my fmriprep outputs just to keep the proc consistent. Then, I will run QC metrics (e.g., tSNR, FD, generate connectivity matrices) to compare meica3.2 and the tedana options. Hoping that comparison will shed light on which method works best for our data. Thanks again to all for your ongoing interest and help.
Thank you @ColleenHughes ! I’ll have a look at the curves.
For the record, yesterday we made these optimization curves more accesible in mapca with PR #43, and have started a discussion on how to make this decision more transparent in tedana itself (issue #834).
@ColleenHughes I have been looking at the code and I’m afraid I will need the mask and the 4D dimensions of your data to get the curves.
Alternatively, you could generate them yourself now that the values are accessible with mapca.aic_, mapca.kic_ and mapca.mdl_. So, you could add a breakpoint on this line in tedana and instead of running ma_pca, you can run:
Another option is that we release a new version of tedana that already saves these curves and returns the different selections as part of the PCA mixing matrix. I really don’t know how long this will take though.
Thanks for taking a look - I’m following the conversation on the github as well. I’ll try generating them myself so I know how to do it on the other test subjects.
Hi! I am following this conversation very closely and I have some questions related to what Colleen (my lab mate) has been asking.
First, I would like to thank you all so much for all your efforts, very much appreciated!
I am taking a deeper dive into MEICA3.2 code - we are trying to compare outputs from tedana and MEICA3.2, as Colleen mentioned, and I have some questions related to how the two differ in component selection. I am assuming it is the ICA component selection stage that is responsible for differences in what the # of components is when running MEICA3.2 and tedana on the same subjects? If I am understanding this right, MEICA3.2 uses clustering and SVM for component selection. I went back to the select_model_fft20e.py code to try and figure out how exactly SVM was coded.
Here are my questions:
Why is there the option of having both SVC and LinearSVC implemented?
C is scaled using L1 penalty but why only for LinearSVC? Is it something specific to LinearSVCs?
What is variable spz2 that is used to render the hyperplane?
I’m going to try to read the code and make some sense of it. Maybe I can answer some of your questions.
Anyway, if there’s anything I’ve learnt from attending tedana developer meetings that’s the fact that many of the criteria in MEICA were not properly documented or can sometimes be arbitrary. That’s why we encourage people to use tedana, and why we’re trying to make the decisions taken to classify components as clear as possible.
I’ll echo (no pun intended) @e.urunuela in that those details were not fully (or at all documented).
That said, my recollection is that - from a big picture perspective there are 2 major differences. The first is that the PCA->ICA selection is uses kappa/rho selection criteria to determine what components get passed through to ICA. A brief comment on this can be found here (https://github.com/ME-ICA/tedana/issues/101). This approach, which tends to find the most components can more or less be used in the current tedana by applying the ‘kundu’ option for --tedpca (in place of aic or what have you). Using this kundu option, in my hands, has tended to increase the number of components passed through to ICA.
The second major difference is in the labeling of the components, determining signal/noise etc. For that, I have no insight, as it is mostly uncommented and rapidly changing code. From emails with Prantik in the past and discussions with those closer to the development (like @handwerkerd ) this was a constantly changing source of issues, with the code being tweaked to account for newly discovered edge cases day by day (hence the version reaching something like 20e!).
For this, we have discussed trying to implement some of these fancy approaches once the component selection code is cleaned up more and ready for modification.
In summary, using the ‘kundu’ choice will give your component selection step much more to work with (and without the bugs that are present in meica 3.2) but there is currently no replacement for the more advanced component selection logic.
There are several differences between the meica v2 version that we decided to build tedana off of and the meica v3.2 version. I suspect the most noteworthy one is the decision tree where each component is classified as accepted/rejected. We really should get the meica v2 decision tree into our main documentation, but you can see a pdf of the decision flow chart in this comment: https://github.com/ME-ICA/tedana/issues/355#issuecomment-515593755
This is a lot more complex with many more (semi-arbitrary) steps than many people realize. As part of modularizing the decision tree code, I am working on a simplified tree.
meica v3.2 kept some of the complexity of this decision tree, but also made a bunch of changes. The key change is that it used a few rules to decide which components should be definitely accepted or rejected and then used signal value decomposition (I think) to create boundary and classify the rest of the components based on the boundary. I like this idea, but there are two reasons we didn’t immediately build off of it. 1. The code was very confusing in key parts and written in a way that would make it harder to change anything without breaking things. 2. Prantik developed it on just a few datasets of which most were not task based. I saw it fail in serious ways on task-based fMRI data.
For those reasons, I’ve generally avoided meica v3.2, but I’m hoping to revisit some of the ideas in it to see if tedana can benefit from them.
In response to our specific questions, I don’t know. I think the code was left in a state where Prantik was still experimenting with things and some of those options may have been his way to test what may or may not have been better for specific data sets. I can guess the answers to some of your other questions, but based on my (several-year-old) look at the code, what variables seemed like they should do and what they actually did weren’t always the same.
Thank you so much @e.urunuela@dowdlelt@handwerkerd! Glad to hear from somebody else who has experience on MEICA and tedana. We are working through and comparing all options and will get back to you. Thanks again everyone!
Hi, I checked with our team and can share a few subjects if folks would still like to take a look. Let me know and I will email a link to the unprocessed and fmriprepped outputs. But I totally understand if folks can’t take a look or prioritize it immediately.
I should have more information about the QC metrics on different tedpca options early next week.
Okay a few updates, apologies for the long message. I processed and QC’d the test sample of 15 participants in three ways: afni+meica3.2, fmriprep+tedana(mdl), and fmriprep+tedana(kundu2.5_stabilize). I chose to more closely examine the kundu2.5 option over aic/kic because it gave me a larger # of total/accepted components on average. I ran pre/post FD/DVARS on the outputs and created connectivity matrices based on the accepted spatial components (following Kundu’s 2013 PNAS). Outputs can be found here. https://mcgill-my.sharepoint.com/:f:/g/personal/colleen_hughes_mail_mcgill_ca/EhQKa7nrNqlChAk2jhtrOLcBm8750Mjy0Auww7rT3GSQ1Q?e=glNaQU
All methods denoise the data reasonably, but the tedana methods retain some questionable DVARS spikes even in the high kappa (accepted) timeseries although attenuated (e.g., sub-0033). I am not sure to what extent this may be impacting the component results. I ran 3dDespike on the raw data before motion correction, as in the afni pipeline, but this had little effect https://github.com/ME-ICA/tedana/issues/370.
It’s clear that the few number of accepted components in the tedana mdl method negatively affects connectivity estimates, for instance compared to the greater number of components observed from the meica2.5 and 3.2 methods. Altogether, the kundu2.5-stabilize method in tedana seems to be working best on our data, although it’s not exactly clear why we see so few components in the mapca methods. I spoke to a colleague about their 1s TR, 800 volume, multi band multi-echo data processed in tedana, and they had similarly few total/accepted components. Therefore, I don’t think the issue is entirely unique to our dataset. Any thoughts?
Lastly, I noticed a true divide error in the terminal output from tedana but seemingly not recorded in the tedana proc file. Looks like you all are aware of this but it’s fine and/or still open to be fixed. https://github.com/ME-ICA/tedana/issues/762
Error text: true_divide.txt (309 Bytes)
First, I’d like to mention that back when we translated maPCA into Python, we used datasets we had at hand and it looked good on those. It is very helpful to see how the maPCA behaves on other datasets.
Now, this said, I have two comments to make:
The PCA step only determines the total number of components. maPCA provides three criteria to find an optimal number of components to which the data’s dimensionality should be reduced, excluding components that add the lowest variance. We released v0.0.2 of maPCA this week which basically changes the way it performs PCA to give more information to users. Now, it performs PCA considering all possible components, and then reduces the final solution to the optimal number of components calculated with one of the three criteria. This final solution is then used to reconstruct the data and perform ICA on it, considering the new dimensions (number of components kept) .
The number of accepted components is given by the ICA side of the pipeline, as the ICA components go through a “decision tree” that accepts or rejects each component. Of course, it is more likely that the decision tree accepts a higher number of components when the number of components the PCA keeps increases.
So, I see two ways of dealing with this:
You can use another criteria to reduce the dimensionality of the data so that you keep a higher dimensionality (more components). At the end of the day, maPCA is just another way of selecting the number of components you keep, but other criteria can be valid too. I have opened pull request #839 to make use of all this new info that maPCA returns now. This results in tedana printing the number of components and total variance explained when using different criteria (from theoretically most aggressive to least: mdl, kic, aic, 90% variance explained, 95% variance explained). In this PR tedana also plots the optimization curves with the optimal number of components selected by each criterion, similar to the plot I shared on this thread a month ago (with the two varexp options included).
We (tedana devs) have to release the new decision tree asap, which should allow users to use customized decision trees to accept/reject components. I think this is going to be critical to improve the classification of components.
Finally, if you’re seeing that the number of components you have with your dimensionality reduction (PCA) criterion makes sense, but tedana is still misclassifying components (the new decision tree will hopefully fix this), I’d suggest you go through the components and manually classify them. You can use the reports or you can use Rica and save your tedana-compatible manual classification.
I’d like to encourage your colleagues to reach out if they’re facing these issues. At the end of the day, we’re developing tedana for the community. The more we stress the code, the better it will get
P.S.: The connectivity estimates will improve as the number of accepted components improve. Maybe the aic criterion is good enough?
This is a really informative response, thank you for taking the time and effort. I think this all gives me a good handle on how to use tedana for our purposes. Will check out Rica, as well. Like you said, aic might be good enough, so I’ll run those QC steps and compare to the kundu-stabilize option. Looking forward to the new maPCA and tedana decision tree updates! Thanks to all the developers for their hard work.
Hi. Reading this thread with great interest. Struggling with some of the same issues, few components with the “standard” options + “kundu-stabilize”, but way too many to debug when testing “kundu” or asking for say 90% cumulative explained variance (working on series with ~1000vols per run). Could an additional option be to cap the number of components at a given number, say 100 or 200? Similar to what is implemented in fmriprep (https://github.com/nipreps/fmriprep/issues/1051).
--aroma_melodic_dim -200 will produce at most 200 components, but less than that if the automatic dimensionality estimation converges at a lower number.
You should be able to do that with the variance explained option. Now, this may not be intuitive as of v0.0.11, but should be easier to find an adequate variance explained value once PR #839 is merged. Tedana will return a plot with the optimal number of components of each criterion. We could also generate another figure that shows how much variance is explained by each PCA component starting from retaining one component to retaining all 1000 components (in your case). This plot could show where all criteria fall too, just like on the other figure.
Thank you so much for giving feedback! And feel free to contribute to tedana (and all related projects) in any capacity. All help is welcome